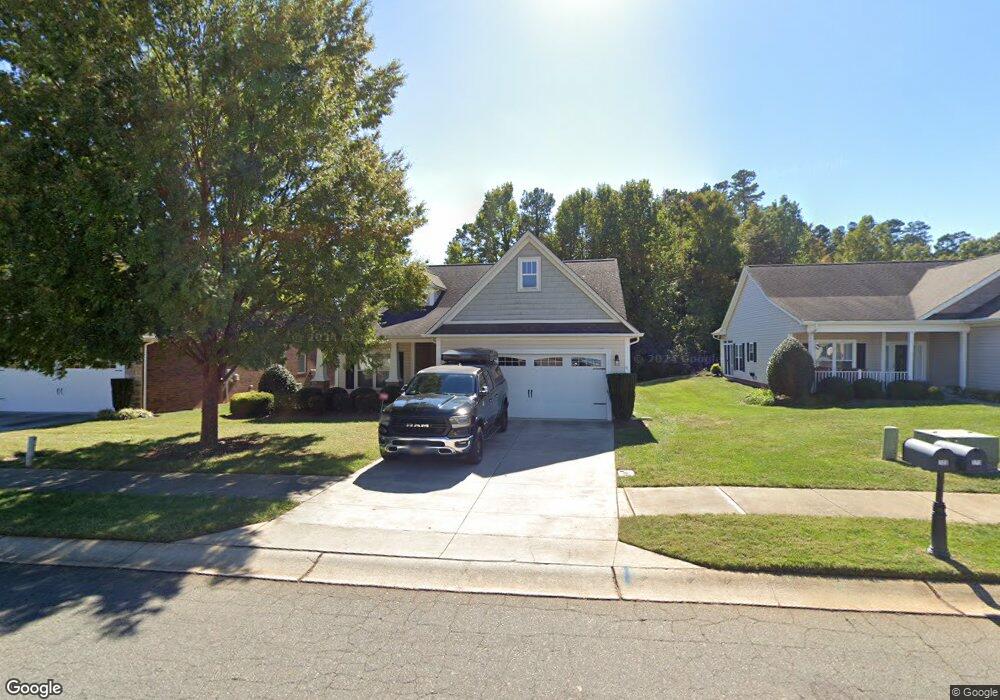
109 Garner Dr Salisbury, NC 28146
Estimated Value: $304,739 - $373,000
Studio
2
Baths
1,570
Sq Ft
$219/Sq Ft
Est. Value
About This Home
This home is located at 109 Garner Dr, Salisbury, NC 28146 and is currently estimated at $344,185, approximately $219 per square foot. 109 Garner Dr is a home located in Rowan County with nearby schools including Granite Quarry Elementary School, Charles C Erwin Middle School, and East Rowan High School.
Ownership History
Date
Name
Owned For
Owner Type
Purchase Details
Closed on
Nov 29, 2017
Sold by
Harrington Martha S and Stuart Deborah H
Bought by
Harrington Martha S and Stuart Deborah H
Current Estimated Value
Purchase Details
Closed on
Jul 7, 2011
Sold by
Spencer Lane Construction Llc
Bought by
Harrington Martha S
Home Financials for this Owner
Home Financials are based on the most recent Mortgage that was taken out on this home.
Original Mortgage
$34,900
Outstanding Balance
$13,664
Interest Rate
4.62%
Mortgage Type
Seller Take Back
Estimated Equity
$330,521
Purchase Details
Closed on
Dec 11, 2008
Sold by
Pierce Rodney Craig and Pierce Melissa S
Bought by
Spencer Lane Construction Llc
Purchase Details
Closed on
Oct 28, 2008
Sold by
Burgess & Associates Inc
Bought by
Pierce Rodney Craig
Create a Home Valuation Report for This Property
The Home Valuation Report is an in-depth analysis detailing your home's value as well as a comparison with similar homes in the area
Purchase History
| Date | Buyer | Sale Price | Title Company |
|---|---|---|---|
| Harrington Martha S | -- | None Available | |
| Harrington Martha S | $175,000 | None Available | |
| Spencer Lane Construction Llc | $40,000 | None Available | |
| Pierce Rodney Craig | -- | None Available |
Source: Public Records
Mortgage History
| Date | Status | Borrower | Loan Amount |
|---|---|---|---|
| Open | Harrington Martha S | $34,900 |
Source: Public Records
Tax History
| Year | Tax Paid | Tax Assessment Tax Assessment Total Assessment is a certain percentage of the fair market value that is determined by local assessors to be the total taxable value of land and additions on the property. | Land | Improvement |
|---|---|---|---|---|
| 2025 | $3,149 | $263,263 | $34,000 | $229,263 |
| 2024 | $3,149 | $263,263 | $34,000 | $229,263 |
| 2023 | $3,149 | $263,263 | $34,000 | $229,263 |
| 2022 | $2,503 | $181,755 | $34,000 | $147,755 |
| 2021 | $2,503 | $181,755 | $34,000 | $147,755 |
| 2020 | $2,503 | $181,755 | $34,000 | $147,755 |
| 2019 | $2,503 | $181,755 | $34,000 | $147,755 |
| 2018 | $2,163 | $159,197 | $34,000 | $125,197 |
| 2017 | $2,152 | $159,197 | $34,000 | $125,197 |
| 2016 | $2,093 | $159,197 | $34,000 | $125,197 |
| 2015 | $2,105 | $159,197 | $34,000 | $125,197 |
| 2014 | $2,117 | $161,979 | $34,000 | $127,979 |
Source: Public Records
Map
Nearby Homes
- 237 River Birch Dr
- 415 Garner Dr
- 327 River Birch Dr
- 520 River Birch Dr
- 200 N Kayla Dr
- 101 S Kayla Dr
- 508 Mulberry Ln
- 507 Oak Brook Dr
- 529 N Main Gq St
- 1230 Faith Rd
- 1207 Oak Haven Dr
- 452 Mirror Lake Rd
- 422 Mirror Lake Rd
- 315 Brookwood Dr
- 0 Old Concord Rd Unit 10094451
- 1305 Wrenwood Ct
- 617 Campbell Ave E
- 1345 Standing Oak Dr
- 208 Stone Ridge Dr
- 155 Trailwood Ct
- 105 Garner Dr
- 113 Garner Dr
- 101 Garner Dr
- 201 River Birch Dr
- 205 River Birch Dr
- 110 Garner Dr
- 106 Garner Dr
- 106 Garner Dr Unit 2
- 114 Garner Dr
- 209 River Birch Dr
- 102 Garner Dr
- 118 Garner Dr
- 213 River Birch Dr
- 115 River Birch Dr
- 111 River Birch Dr
- 217 River Birch Dr
- 122 River Birch Dr
- 2085 Faith Rd
- 118 River Birch Dr
- 114 River Birch Dr
Your Personal Tour Guide
Ask me questions while you tour the home.