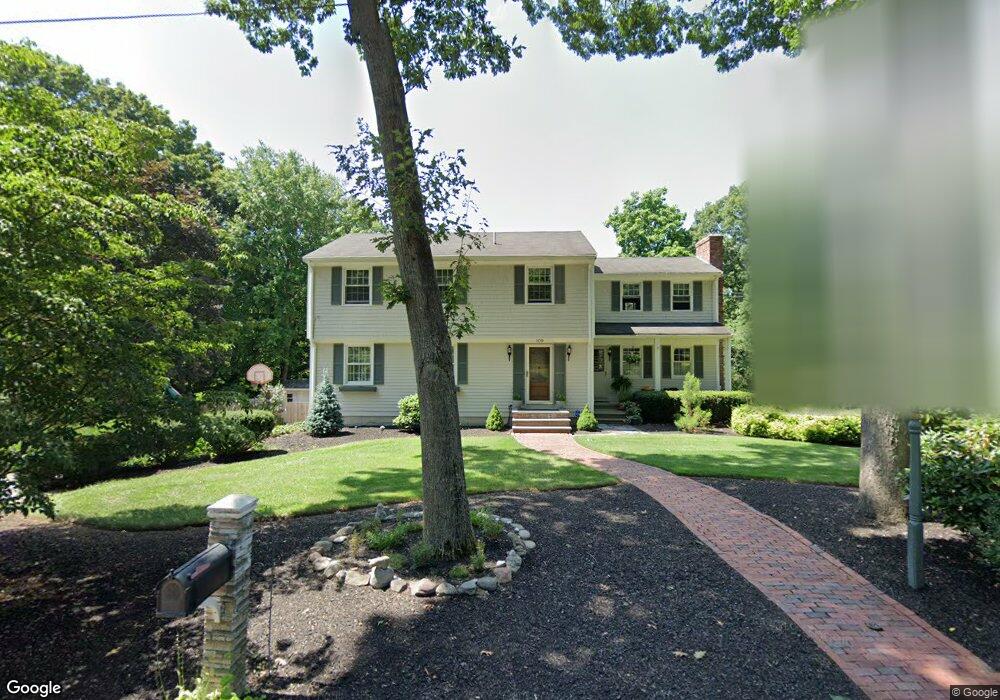
109 Gregory Dr Seekonk, MA 02771
Estimated Value: $577,000 - $801,000
4
Beds
3
Baths
2,956
Sq Ft
$237/Sq Ft
Est. Value
About This Home
This home is located at 109 Gregory Dr, Seekonk, MA 02771 and is currently estimated at $700,579, approximately $237 per square foot. 109 Gregory Dr is a home located in Bristol County with nearby schools including Seekonk High School, St Cecilia School, and Saint Teresa Catholic Elementary School.
Ownership History
Date
Name
Owned For
Owner Type
Purchase Details
Closed on
Jan 11, 2018
Sold by
Laraine H Rawnsley Lt and Rawnsley
Bought by
Laraine H Warnsely Lt and Wawnsley
Current Estimated Value
Purchase Details
Closed on
Jul 25, 2012
Sold by
Rawnsley Laraine H
Bought by
Rawnsley Brian E and Rawnsley Laraine H
Create a Home Valuation Report for This Property
The Home Valuation Report is an in-depth analysis detailing your home's value as well as a comparison with similar homes in the area
Home Values in the Area
Average Home Value in this Area
Purchase History
| Date | Buyer | Sale Price | Title Company |
|---|---|---|---|
| Laraine H Warnsely Lt | -- | -- | |
| Rawnsley Brian E | -- | -- | |
| Rawnsley Laraine H | $165,000 | -- | |
| Rawnsley Brian E | -- | -- |
Source: Public Records
Mortgage History
| Date | Status | Borrower | Loan Amount |
|---|---|---|---|
| Previous Owner | Rawnsley Brian E | $150,000 | |
| Previous Owner | Rawnsley Brian E | $95,000 | |
| Previous Owner | Rawnsley Brian E | $130,000 |
Source: Public Records
Tax History
| Year | Tax Paid | Tax Assessment Tax Assessment Total Assessment is a certain percentage of the fair market value that is determined by local assessors to be the total taxable value of land and additions on the property. | Land | Improvement |
|---|---|---|---|---|
| 2025 | $7,472 | $605,000 | $160,000 | $445,000 |
| 2024 | $7,138 | $578,000 | $160,000 | $418,000 |
| 2023 | $6,900 | $526,300 | $143,400 | $382,900 |
| 2022 | $6,302 | $472,400 | $143,400 | $329,000 |
| 2021 | $6,048 | $445,700 | $122,500 | $323,200 |
| 2020 | $5,895 | $447,600 | $122,900 | $324,700 |
| 2019 | $5,594 | $428,300 | $122,900 | $305,400 |
| 2018 | $5,599 | $419,400 | $122,900 | $296,500 |
| 2017 | $5,208 | $386,900 | $124,300 | $262,600 |
| 2016 | $5,153 | $384,300 | $124,300 | $260,000 |
| 2015 | $5,057 | $382,200 | $124,300 | $257,900 |
Source: Public Records
Map
Nearby Homes
- 127 Ricard St
- 99 Roosevelt St
- 105 Metropolitan Park Ave
- 64 Brookdale Blvd
- 3 Hutchinson Ave
- 128 Warwick Rd
- 1150 Newman Ave
- 496 Daggett Ave
- 141 Hanover Ave
- 76 London Ave
- 43 Warwick Rd
- 0 Perrin Ave
- 619 Armistice Blvd
- 15 Draper St
- 888 Central Ave
- 0
- 139 Suffolk Ave
- 26 Haig Ave
- 76 Case Ave Unit 76
- 200 Carter Ave
Your Personal Tour Guide
Ask me questions while you tour the home.