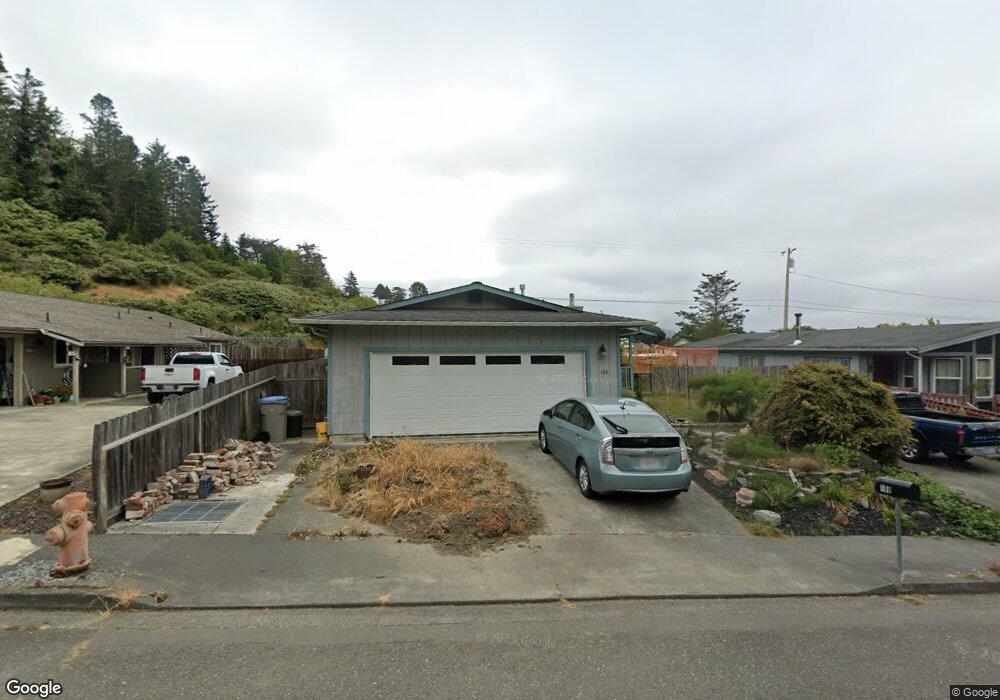
109 Harlan Way Fortuna, CA 95540
Estimated Value: $361,000 - $440,000
--
Bed
--
Bath
--
Sq Ft
7,013
Sq Ft Lot
About This Home
This home is located at 109 Harlan Way, Fortuna, CA 95540 and is currently estimated at $392,107. 109 Harlan Way is a home located in Humboldt County with nearby schools including East High School, Fortuna Union High School, and Redwood Preparatory Charter School.
Ownership History
Date
Name
Owned For
Owner Type
Purchase Details
Closed on
Jul 9, 2013
Sold by
Kosarich Danette
Bought by
Kosarich Danette and Kosarich Scott A
Current Estimated Value
Home Financials for this Owner
Home Financials are based on the most recent Mortgage that was taken out on this home.
Original Mortgage
$55,000
Interest Rate
3.79%
Mortgage Type
New Conventional
Purchase Details
Closed on
Jan 11, 2007
Sold by
Kosarich Danette and Estate Of Chloe M Krader
Bought by
Kosarich Danette
Create a Home Valuation Report for This Property
The Home Valuation Report is an in-depth analysis detailing your home's value as well as a comparison with similar homes in the area
Home Values in the Area
Average Home Value in this Area
Purchase History
| Date | Buyer | Sale Price | Title Company |
|---|---|---|---|
| Kosarich Danette | -- | Humboldt Land Title Company | |
| Kosarich Danette | -- | None Available | |
| Kosarich Danette | -- | None Available | |
| Kosarich Danette | -- | None Available |
Source: Public Records
Mortgage History
| Date | Status | Borrower | Loan Amount |
|---|---|---|---|
| Closed | Kosarich Danette | $55,000 |
Source: Public Records
Tax History Compared to Growth
Tax History
| Year | Tax Paid | Tax Assessment Tax Assessment Total Assessment is a certain percentage of the fair market value that is determined by local assessors to be the total taxable value of land and additions on the property. | Land | Improvement |
|---|---|---|---|---|
| 2025 | $2,375 | $229,794 | $50,378 | $179,416 |
| 2024 | $2,375 | $225,290 | $49,391 | $175,899 |
| 2023 | $2,328 | $220,873 | $48,423 | $172,450 |
| 2022 | $2,320 | $216,543 | $47,474 | $169,069 |
| 2021 | $2,285 | $212,298 | $46,544 | $165,754 |
| 2020 | $2,282 | $210,122 | $46,067 | $164,055 |
| 2019 | $2,239 | $206,003 | $45,164 | $160,839 |
| 2018 | $2,209 | $201,965 | $44,279 | $157,686 |
| 2017 | $2,104 | $198,006 | $43,411 | $154,595 |
| 2016 | $2,052 | $194,124 | $42,560 | $151,564 |
| 2015 | $1,963 | $191,209 | $41,921 | $149,288 |
| 2014 | $1,740 | $171,269 | $41,100 | $130,169 |
Source: Public Records
Map
Nearby Homes