
J
Landlord's Agent in 2020
Jill Finkelstein & Associates
Compass
(781) 258-7014
31 in this area
60 Total Sales

Estimated Value: $949,000 - $1,251,573
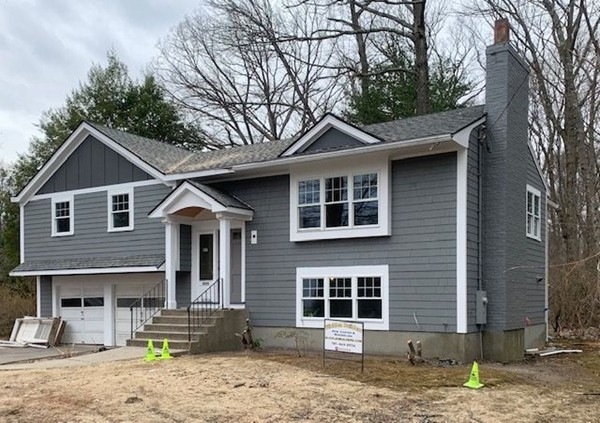
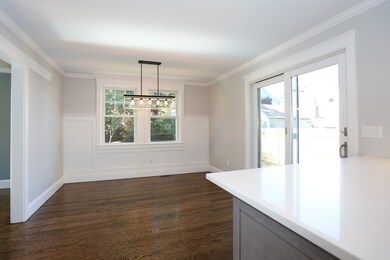
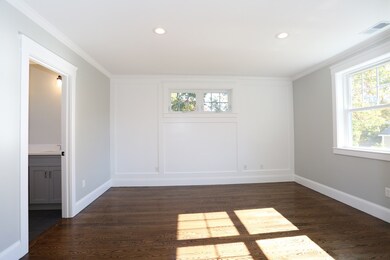
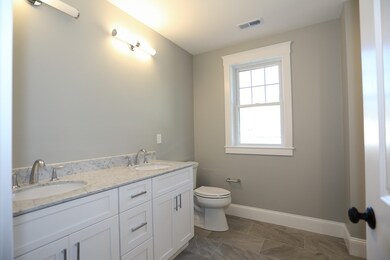
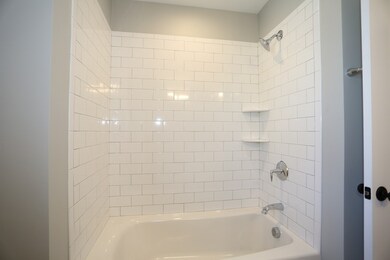
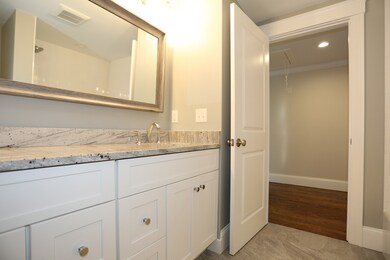
Fabulous in-town location near train, restaurants and all needham has to offer. This spacious 3-4 bedroom home is fully renovated, a sparkling new kitchen with SS appliances open to dining area and living room with a wood burning fire place, a separate office/den off the kitchen. Three good size bedrooms and a full bath completes the main floor living area. The lower level has a family room, a full bath and another office/bedroom plus a laundry closet with w/d units. Convenient direct entry from the two car garage into the lower level with closet and custom built bench and cubbies. New gas heating system with central air-conditioning. Pictures are of builders previous projects, similar finishes to be installed.
Last Renter's Agent
John Haberis
Boston Realty Relocations
| Date | Buyer | Sale Price | Title Company |
|---|---|---|---|
| Slicken Builders Inc | $674,000 | None Available |
| Date | Status | Borrower | Loan Amount |
|---|---|---|---|
| Open | Slicken Builders Inc | $569,200 |
| Date | Event | Price | List to Sale | Price per Sq Ft |
|---|---|---|---|---|
| 04/15/2020 04/15/20 | Rented | $4,350 | +3.6% | -- |
| 03/24/2020 03/24/20 | Under Contract | -- | -- | -- |
| 03/13/2020 03/13/20 | For Rent | $4,200 | -4.5% | -- |
| 03/04/2020 03/04/20 | Off Market | $4,400 | -- | -- |
| 02/29/2020 02/29/20 | For Rent | $4,400 | -- | -- |
| Year | Tax Paid | Tax Assessment Tax Assessment Total Assessment is a certain percentage of the fair market value that is determined by local assessors to be the total taxable value of land and additions on the property. | Land | Improvement |
|---|---|---|---|---|
| 2025 | $10,404 | $981,500 | $711,200 | $270,300 |
| 2024 | $9,061 | $723,700 | $519,200 | $204,500 |
| 2023 | $9,241 | $708,700 | $519,200 | $189,500 |
| 2022 | $9,039 | $676,100 | $489,800 | $186,300 |
| 2021 | $8,810 | $676,100 | $489,800 | $186,300 |
| 2020 | $8,180 | $654,900 | $489,800 | $165,100 |
| 2019 | $7,546 | $609,000 | $445,300 | $163,700 |
| 2018 | $7,235 | $609,000 | $445,300 | $163,700 |
| 2017 | $6,996 | $588,400 | $445,300 | $143,100 |
| 2016 | $6,790 | $588,400 | $445,300 | $143,100 |
| 2015 | $6,643 | $588,400 | $445,300 | $143,100 |
| 2014 | $6,324 | $543,300 | $404,800 | $138,500 |
J
Landlord's Agent in 2020
Jill Finkelstein & Associates
Compass
(781) 258-7014
31 in this area
60 Total Sales
J
Tenant's Agent in 2020
John Haberis
Boston Realty Relocations
Source: MLS Property Information Network (MLS PIN)
MLS Number: 72625916
APN: NEED-000132-000071
Disclaimer: Certain information contained herein is derived from information provided by parties other than Homes.com. All information provided is deemed reliable, but is not guaranteed to be accurate and should be independently verified.
![]() The property listing data and information, or the Images, set forth herein were provided to MLS Property Information Network, Inc. from third party sources, including sellers, lessors and public records, and were compiled by MLS Property Information Network, Inc. The property listing data and information, and the Images, are for the personal, non-commercial use of consumers having a good faith interest in purchasing or leasing listed properties of the type displayed to them and may not be used for any purpose other than to identify prospective properties which such consumers may have a good faith interest in purchasing or leasing. MLS Property Information Network, Inc. and its subscribers disclaim any and all representations and warranties as to the accuracy of the property listing data and information, or as to the accuracy of any of the Images, set forth herein.
The property listing data and information, or the Images, set forth herein were provided to MLS Property Information Network, Inc. from third party sources, including sellers, lessors and public records, and were compiled by MLS Property Information Network, Inc. The property listing data and information, and the Images, are for the personal, non-commercial use of consumers having a good faith interest in purchasing or leasing listed properties of the type displayed to them and may not be used for any purpose other than to identify prospective properties which such consumers may have a good faith interest in purchasing or leasing. MLS Property Information Network, Inc. and its subscribers disclaim any and all representations and warranties as to the accuracy of the property listing data and information, or as to the accuracy of any of the Images, set forth herein.