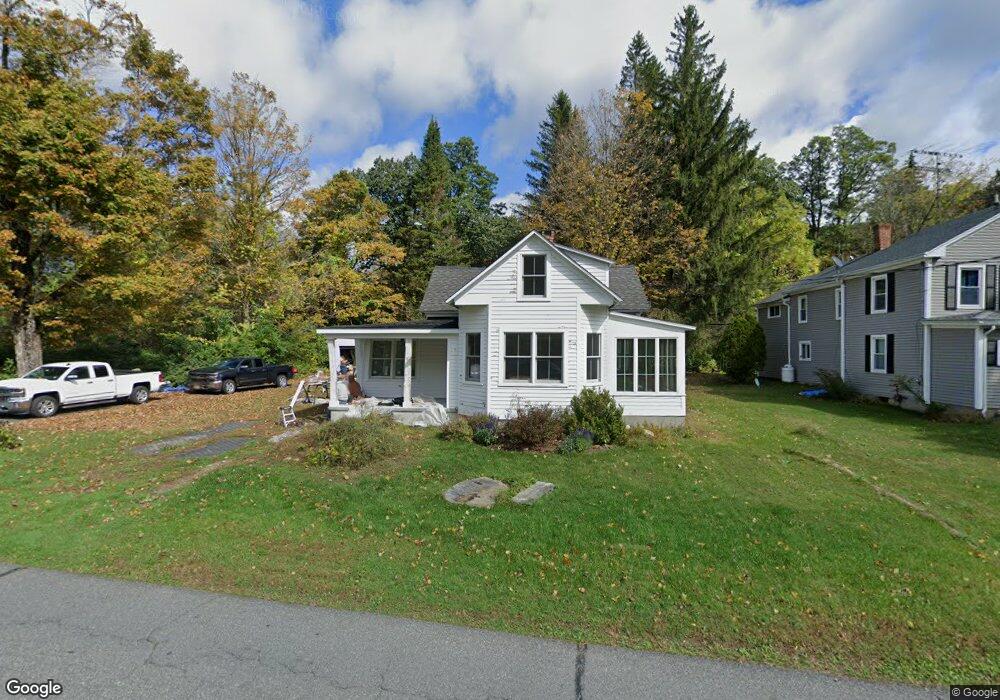
109 Main Rd Tyringham, MA 01264
Estimated Value: $337,798 - $699,000
4
Beds
2
Baths
1,300
Sq Ft
$389/Sq Ft
Est. Value
About This Home
This home is located at 109 Main Rd, Tyringham, MA 01264 and is currently estimated at $505,200, approximately $388 per square foot. 109 Main Rd is a home located in Berkshire County with nearby schools including Lee Elementary School and Lee Middle/High School.
Ownership History
Date
Name
Owned For
Owner Type
Purchase Details
Closed on
Jul 11, 2024
Sold by
Bravo Lawrence A
Bought by
109 Main Rd Re Nt and Bravo
Current Estimated Value
Purchase Details
Closed on
Jun 14, 2004
Sold by
Storti Jennifer A
Bought by
Bravo Lawrence A
Home Financials for this Owner
Home Financials are based on the most recent Mortgage that was taken out on this home.
Original Mortgage
$210,000
Interest Rate
5.99%
Mortgage Type
Purchase Money Mortgage
Create a Home Valuation Report for This Property
The Home Valuation Report is an in-depth analysis detailing your home's value as well as a comparison with similar homes in the area
Purchase History
| Date | Buyer | Sale Price | Title Company |
|---|---|---|---|
| 109 Main Rd Re Nt | -- | None Available | |
| 109 Main Rd Re Nt | -- | None Available | |
| Bravo Lawrence A | $267,500 | -- | |
| Bravo Lawrence A | $267,500 | -- |
Source: Public Records
Mortgage History
| Date | Status | Borrower | Loan Amount |
|---|---|---|---|
| Previous Owner | Bravo Lawrence A | $210,000 | |
| Previous Owner | Bravo Lawrence A | $210,000 |
Source: Public Records
Tax History
| Year | Tax Paid | Tax Assessment Tax Assessment Total Assessment is a certain percentage of the fair market value that is determined by local assessors to be the total taxable value of land and additions on the property. | Land | Improvement |
|---|---|---|---|---|
| 2025 | $1,798 | $293,800 | $65,300 | $228,500 |
| 2024 | $1,740 | $278,000 | $63,500 | $214,500 |
| 2023 | $1,742 | $264,800 | $60,600 | $204,200 |
| 2022 | $1,765 | $262,700 | $60,600 | $202,100 |
| 2021 | $1,751 | $253,800 | $58,800 | $195,000 |
| 2020 | $1,377 | $239,700 | $58,800 | $180,900 |
| 2019 | $1,774 | $264,400 | $58,800 | $205,600 |
| 2018 | $1,478 | $263,900 | $58,800 | $205,100 |
| 2017 | $1,478 | $257,900 | $57,700 | $200,200 |
| 2016 | $1,736 | $257,500 | $57,700 | $199,800 |
| 2015 | $1,501 | $225,400 | $57,700 | $167,700 |
Source: Public Records
Map
Nearby Homes
Your Personal Tour Guide
Ask me questions while you tour the home.