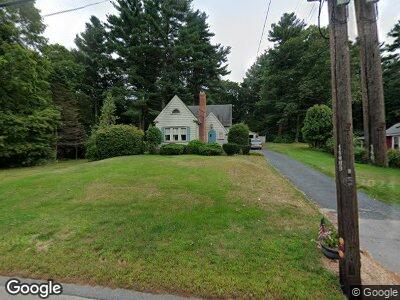
109 Main St Norfolk, MA 02056
Estimated Value: $441,000 - $563,000
3
Beds
1
Bath
1,198
Sq Ft
$413/Sq Ft
Est. Value
About This Home
This home is located at 109 Main St, Norfolk, MA 02056 and is currently estimated at $494,250, approximately $412 per square foot. 109 Main St is a home located in Norfolk County with nearby schools including H. Olive Day School, Freeman-Kennedy School, and Woodside Montessori Academy.
Ownership History
Date
Name
Owned For
Owner Type
Purchase Details
Closed on
Jun 7, 2021
Sold by
Shivers Ft
Bought by
Myers Donald J and Mcintyre Joanne
Current Estimated Value
Home Financials for this Owner
Home Financials are based on the most recent Mortgage that was taken out on this home.
Original Mortgage
$325,000
Outstanding Balance
$297,432
Interest Rate
2.9%
Mortgage Type
Purchase Money Mortgage
Estimated Equity
$219,206
Create a Home Valuation Report for This Property
The Home Valuation Report is an in-depth analysis detailing your home's value as well as a comparison with similar homes in the area
Home Values in the Area
Average Home Value in this Area
Purchase History
| Date | Buyer | Sale Price | Title Company |
|---|---|---|---|
| Myers Donald J | $406,250 | None Available |
Source: Public Records
Mortgage History
| Date | Status | Borrower | Loan Amount |
|---|---|---|---|
| Open | Myers Donald J | $325,000 | |
| Previous Owner | Shivers John P | $20,000 |
Source: Public Records
Tax History Compared to Growth
Tax History
| Year | Tax Paid | Tax Assessment Tax Assessment Total Assessment is a certain percentage of the fair market value that is determined by local assessors to be the total taxable value of land and additions on the property. | Land | Improvement |
|---|---|---|---|---|
| 2025 | $5,853 | $366,500 | $218,300 | $148,200 |
| 2024 | $5,903 | $379,100 | $230,900 | $148,200 |
| 2023 | $6,702 | $408,400 | $220,500 | $187,900 |
| 2022 | $6,259 | $343,900 | $204,200 | $139,700 |
| 2021 | $5,973 | $332,000 | $179,400 | $152,600 |
| 2020 | $5,810 | $311,700 | $171,800 | $139,900 |
| 2019 | $5,635 | $308,100 | $171,800 | $136,300 |
| 2018 | $5,327 | $286,100 | $158,200 | $127,900 |
| 2017 | $5,249 | $288,100 | $158,200 | $129,900 |
| 2016 | $4,847 | $268,100 | $154,600 | $113,500 |
| 2015 | $4,636 | $262,500 | $147,300 | $115,200 |
| 2014 | $4,603 | $264,100 | $147,300 | $116,800 |
Source: Public Records
Map
Nearby Homes
- 15 Boyde's Crossing
- 15 Boyde's Crossing Unit 13
- 63 Boyde's Crossing Unit 38
- 38 Boardman St
- 48 Meetinghouse Rd Unit 48
- 27 Meetinghouse Rd
- 81 Meetinghouse Rd Unit 81
- 50 Meetinghouse Rd Unit 50
- 30 Castle Rd
- 10 Wrights Farm Rd
- 10 Keeney Pond Rd
- 16 Keeney Pond Rd
- 7 Keeney Pond Rd
- 18 Keeney Pond Rd
- 6 Trailside Way
- 35 Cleary Cir Unit 7
- 12 Norway Farms Dr
- 98 Union St
- 8 Fredrickson Rd
- 2 Diamond St
- 109 Main St
- 111 Main St
- 113 Main St
- 105 Main St
- 115 Main St
- Lot 24 Boyde's Crossing Unit 24
- 112 Main St
- 103 Main St
- 64 Boydes Crossing Unit 64
- 62 Boydes Crossing Unit 62
- 118 Main St
- 118 Main St Unit A
- 118 Main St Unit B
- 114 Main St
- 101 Main St
- 108 Main St
- 2 Boyde's Crossing Unit 2
- 2 Boyde's Crossing Unit 1
- 2 Boydes Crossing Unit 2
- 57 Boyde's Crossing Unit 35