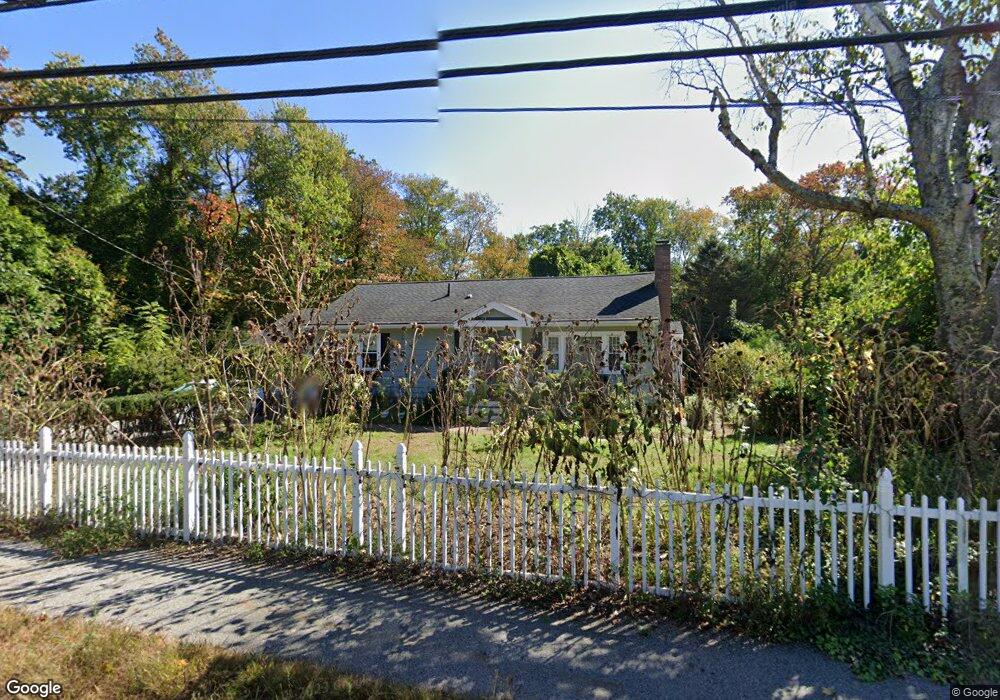
109 Maple St Lexington, MA 02420
Countryside NeighborhoodEstimated Value: $936,000 - $1,224,000
2
Beds
2
Baths
1,650
Sq Ft
$672/Sq Ft
Est. Value
About This Home
This home is located at 109 Maple St, Lexington, MA 02420 and is currently estimated at $1,109,204, approximately $672 per square foot. 109 Maple St is a home located in Middlesex County with nearby schools including Harrington Elementary School, Jonas Clarke Middle School, and Lexington High School.
Ownership History
Date
Name
Owned For
Owner Type
Purchase Details
Closed on
Nov 16, 2010
Sold by
Tripi Jack L and Tripi Patricia A
Bought by
Bavirisetty Mohan K and Bavirisetty Padma M
Current Estimated Value
Home Financials for this Owner
Home Financials are based on the most recent Mortgage that was taken out on this home.
Original Mortgage
$230,000
Outstanding Balance
$151,776
Interest Rate
4.35%
Mortgage Type
Purchase Money Mortgage
Estimated Equity
$957,428
Purchase Details
Closed on
Apr 3, 2002
Sold by
Minassian Kamer H and Minassian Chake K
Bought by
Tripi Jack L and Tripi Patricia A
Home Financials for this Owner
Home Financials are based on the most recent Mortgage that was taken out on this home.
Original Mortgage
$200,000
Interest Rate
6.85%
Mortgage Type
Purchase Money Mortgage
Create a Home Valuation Report for This Property
The Home Valuation Report is an in-depth analysis detailing your home's value as well as a comparison with similar homes in the area
Home Values in the Area
Average Home Value in this Area
Purchase History
| Date | Buyer | Sale Price | Title Company |
|---|---|---|---|
| Bavirisetty Mohan K | $481,000 | -- | |
| Tripi Jack L | $370,000 | -- |
Source: Public Records
Mortgage History
| Date | Status | Borrower | Loan Amount |
|---|---|---|---|
| Open | Bavirisetty Mohan K | $230,000 | |
| Previous Owner | Tripi Jack L | $200,000 |
Source: Public Records
Tax History
| Year | Tax Paid | Tax Assessment Tax Assessment Total Assessment is a certain percentage of the fair market value that is determined by local assessors to be the total taxable value of land and additions on the property. | Land | Improvement |
|---|---|---|---|---|
| 2025 | $12,132 | $992,000 | $623,000 | $369,000 |
| 2024 | $11,772 | $961,000 | $593,000 | $368,000 |
| 2023 | $11,453 | $881,000 | $539,000 | $342,000 |
| 2022 | $10,874 | $788,000 | $490,000 | $298,000 |
| 2021 | $10,649 | $740,000 | $467,000 | $273,000 |
| 2020 | $10,228 | $728,000 | $467,000 | $261,000 |
| 2019 | $4,927 | $680,000 | $445,000 | $235,000 |
| 2018 | $12,666 | $644,000 | $423,000 | $221,000 |
| 2017 | $8,187 | $565,000 | $403,000 | $162,000 |
| 2016 | $7,753 | $531,000 | $380,000 | $151,000 |
| 2015 | $7,252 | $488,000 | $345,000 | $143,000 |
| 2014 | $6,980 | $450,000 | $314,000 | $136,000 |
Source: Public Records
Map
Nearby Homes
Your Personal Tour Guide
Ask me questions while you tour the home.