R
Seller's Agent in 2012
Renee Sommer
County Line Realty

Estimated Value: $55,000 - $89,000
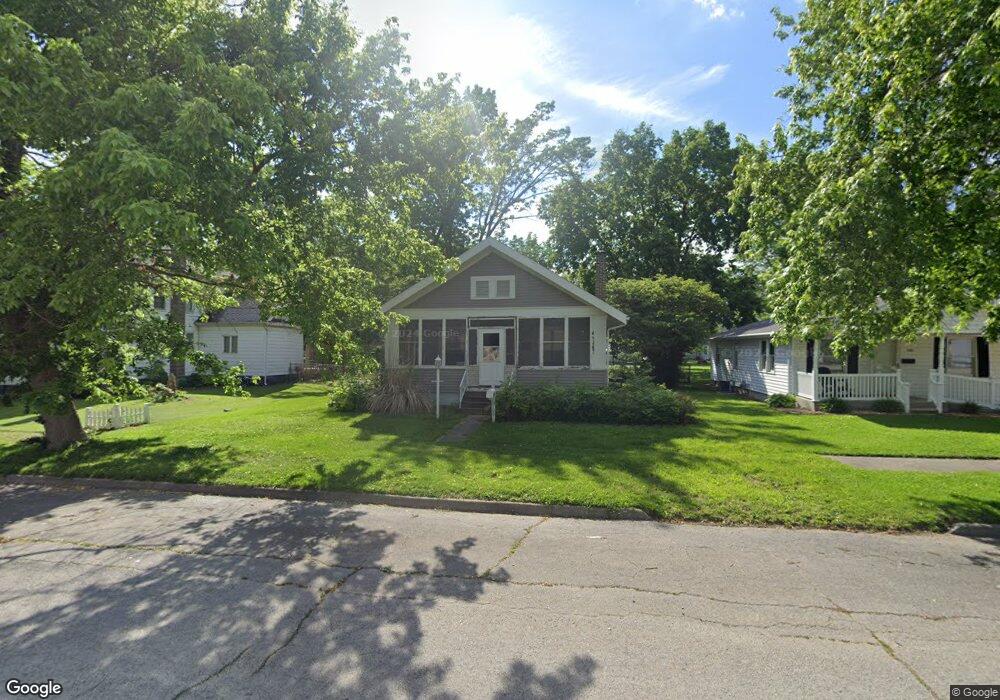
Take a step back into time with this charming bungalow.+ý-ý Large living room complete with masonry fireplace and hardwood floors runs all the way across the front of the house. Built-in book cases divide the living room and dining room.+ý-ý Kitchen has floor to ceiling cabinets.+ý-ý Walk-up finished attic offers a lot of potential.+ý-ý Hardwood floors and ceiling fans in the bedrooms and dining rooms.+ý-ý And don't forget to bring your rocking chair; screened-in porch will keep you bug free.+ý-ý Outside perks, fenced yard and 2 car garage with alley entrance. See HUDHomestore.com for bidding timelines and addenda.
Last Agent to Sell the Property
Renee Sommer
County Line Realty Listed on: 08/20/2012
| Date | Buyer | Sale Price | Title Company |
|---|---|---|---|
| Anderson Phillip W | -- | Lakeshore Title Agency | |
| The Secretary Of Hud | $79,252 | None Available |
| Date | Status | Borrower | Loan Amount |
|---|---|---|---|
| Open | Anderson Phillip W | $19,200 |
| Date | Event | Price | List to Sale | Price per Sq Ft |
|---|---|---|---|---|
| 10/15/2012 10/15/12 | Sold | $24,500 | 0.0% | $21 / Sq Ft |
| 09/15/2012 09/15/12 | Pending | -- | -- | -- |
| 08/20/2012 08/20/12 | For Sale | $24,500 | -- | $21 / Sq Ft |
| Year | Tax Paid | Tax Assessment Tax Assessment Total Assessment is a certain percentage of the fair market value that is determined by local assessors to be the total taxable value of land and additions on the property. | Land | Improvement |
|---|---|---|---|---|
| 2024 | $62 | $11,640 | $3,419 | $8,221 |
| 2023 | -- | $10,997 | $3,230 | $7,767 |
| 2022 | $0 | $8,889 | $3,208 | $5,681 |
| 2020 | $0 | $8,346 | $3,012 | $5,334 |
| 2019 | $422 | $8,543 | $3,083 | $5,460 |
| 2018 | $0 | $8,475 | $3,012 | $5,463 |
| 2017 | $422 | $8,647 | $3,073 | $5,574 |
| 2016 | $418 | $8,622 | $3,064 | $5,558 |
| 2015 | $423 | $8,523 | $3,029 | $5,494 |
| 2014 | $425 | $7,927 | $2,817 | $5,110 |
| 2013 | $714 | $8,000 | $2,816 | $5,184 |
| 2011 | $1,701 | $23,440 | $2,883 | $20,557 |
R
Seller's Agent in 2012
Renee Sommer
County Line Realty
H
Buyer's Agent in 2012
Heath-Stacy Spracklen
Carol & Company
(217) 820-9687
26 in this area
39 Total Sales
Source: Central Illinois Board of REALTORS®
MLS Number: 4216498
APN: 11-25-22-108-008-00
Ask me questions while you tour the home.
