109 Maple St Thornton, IA 50479
Estimated Value: $103,000 - $123,000
4
Beds
1
Bath
1,224
Sq Ft
$95/Sq Ft
Est. Value
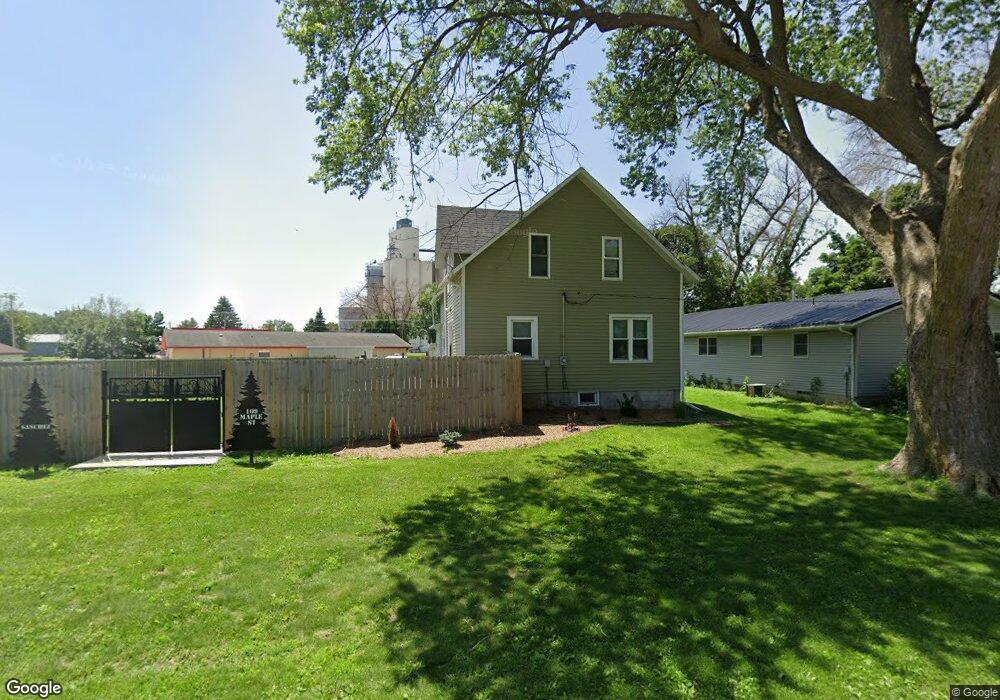
About This Home
This home is located at 109 Maple St, Thornton, IA 50479 and is currently estimated at $116,290, approximately $95 per square foot. 109 Maple St is a home located in Cerro Gordo County with nearby schools including West Fork High School.
Ownership History
Date
Name
Owned For
Owner Type
Purchase Details
Closed on
Apr 17, 2018
Sold by
Johnson Sherry L
Bought by
Sanchez Saul E
Current Estimated Value
Home Financials for this Owner
Home Financials are based on the most recent Mortgage that was taken out on this home.
Original Mortgage
$72,727
Outstanding Balance
$62,424
Interest Rate
4.45%
Mortgage Type
Purchase Money Mortgage
Estimated Equity
$53,866
Purchase Details
Closed on
Feb 12, 2008
Sold by
Dirks Muriel Ann and Dirks Muriel A
Bought by
Johnson Sherry L
Home Financials for this Owner
Home Financials are based on the most recent Mortgage that was taken out on this home.
Original Mortgage
$15,000
Interest Rate
6.11%
Mortgage Type
Purchase Money Mortgage
Create a Home Valuation Report for This Property
The Home Valuation Report is an in-depth analysis detailing your home's value as well as a comparison with similar homes in the area
Home Values in the Area
Average Home Value in this Area
Purchase History
| Date | Buyer | Sale Price | Title Company |
|---|---|---|---|
| Sanchez Saul E | $72,000 | -- | |
| Johnson Sherry L | $48,000 | None Available |
Source: Public Records
Mortgage History
| Date | Status | Borrower | Loan Amount |
|---|---|---|---|
| Open | Sanchez Saul E | $72,727 | |
| Previous Owner | Johnson Sherry L | $15,000 |
Source: Public Records
Tax History Compared to Growth
Tax History
| Year | Tax Paid | Tax Assessment Tax Assessment Total Assessment is a certain percentage of the fair market value that is determined by local assessors to be the total taxable value of land and additions on the property. | Land | Improvement |
|---|---|---|---|---|
| 2025 | $1,332 | $109,790 | $13,200 | $96,590 |
| 2024 | $1,332 | $98,380 | $13,200 | $85,180 |
| 2023 | $1,222 | $98,380 | $13,200 | $85,180 |
| 2022 | $1,110 | $81,610 | $10,560 | $71,050 |
| 2021 | $1,122 | $75,500 | $10,560 | $64,940 |
| 2020 | $1,271 | $73,350 | $10,560 | $62,790 |
| 2019 | $1,144 | $0 | $0 | $0 |
| 2018 | $840 | $0 | $0 | $0 |
| 2017 | $858 | $0 | $0 | $0 |
| 2016 | $814 | $0 | $0 | $0 |
| 2015 | $814 | $0 | $0 | $0 |
| 2014 | $928 | $0 | $0 | $0 |
| 2013 | $858 | $0 | $0 | $0 |
Source: Public Records
Map
Nearby Homes