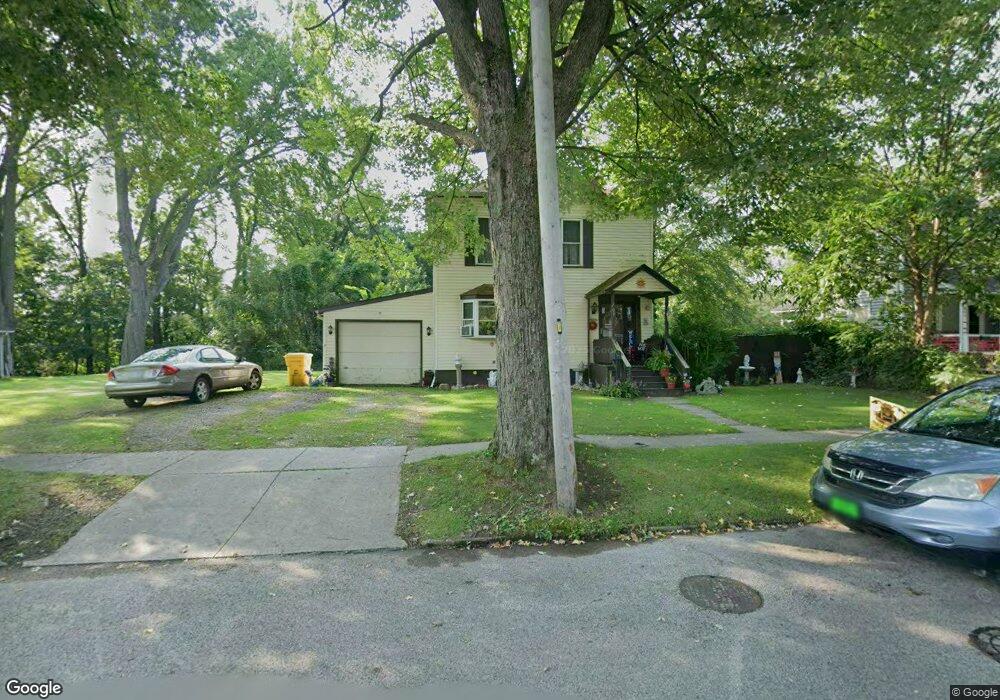
109 Marshall St Conneaut, OH 44030
Estimated Value: $96,000 - $129,000
4
Beds
1
Bath
1,536
Sq Ft
$71/Sq Ft
Est. Value
About This Home
This home is located at 109 Marshall St, Conneaut, OH 44030 and is currently estimated at $109,187, approximately $71 per square foot. 109 Marshall St is a home located in Ashtabula County with nearby schools including Lakeshore Primary Elementary School, Gateway Elementary School, and Conneaut Middle School.
Ownership History
Date
Name
Owned For
Owner Type
Purchase Details
Closed on
Jun 26, 2007
Sold by
Thayer Margaret B
Bought by
Hyde Valerie
Current Estimated Value
Home Financials for this Owner
Home Financials are based on the most recent Mortgage that was taken out on this home.
Original Mortgage
$63,002
Outstanding Balance
$38,882
Interest Rate
6.26%
Mortgage Type
FHA
Estimated Equity
$70,305
Purchase Details
Closed on
Jul 13, 2003
Sold by
Thayer Walter E
Bought by
Thayer Investments
Purchase Details
Closed on
Feb 18, 2003
Sold by
Anderson Deborah M
Bought by
Thayer Walter E
Purchase Details
Closed on
Jun 23, 1999
Sold by
Thayer Walter E
Bought by
Anderson David J and Anderson Deborah M
Home Financials for this Owner
Home Financials are based on the most recent Mortgage that was taken out on this home.
Original Mortgage
$20,000
Interest Rate
7.15%
Mortgage Type
New Conventional
Purchase Details
Closed on
Dec 10, 1998
Sold by
Stoker Gordon C
Bought by
Thayer Walter E
Create a Home Valuation Report for This Property
The Home Valuation Report is an in-depth analysis detailing your home's value as well as a comparison with similar homes in the area
Home Values in the Area
Average Home Value in this Area
Purchase History
| Date | Buyer | Sale Price | Title Company |
|---|---|---|---|
| Hyde Valerie | $63,500 | Attorney | |
| Hyde Valerie | -- | Attorney | |
| Hyde Valerie | -- | Attorney | |
| Thayer Investments | -- | -- | |
| Thayer Walter E | -- | -- | |
| Anderson David J | $18,000 | -- | |
| Thayer Walter E | $17,000 | -- |
Source: Public Records
Mortgage History
| Date | Status | Borrower | Loan Amount |
|---|---|---|---|
| Open | Hyde Valerie | $63,002 | |
| Previous Owner | Anderson David J | $20,000 |
Source: Public Records
Tax History
| Year | Tax Paid | Tax Assessment Tax Assessment Total Assessment is a certain percentage of the fair market value that is determined by local assessors to be the total taxable value of land and additions on the property. | Land | Improvement |
|---|---|---|---|---|
| 2024 | $1,283 | $17,540 | $3,080 | $14,460 |
| 2023 | $820 | $17,540 | $3,080 | $14,460 |
| 2022 | $766 | $14,420 | $2,380 | $12,040 |
| 2021 | $779 | $14,420 | $2,380 | $12,040 |
| 2020 | $779 | $14,420 | $2,380 | $12,040 |
| 2019 | $523 | $9,460 | $1,510 | $7,950 |
| 2018 | $499 | $9,460 | $1,510 | $7,950 |
| 2017 | $589 | $9,460 | $1,510 | $7,950 |
| 2016 | $672 | $14,040 | $2,240 | $11,800 |
| 2015 | $679 | $14,040 | $2,240 | $11,800 |
| 2014 | $979 | $23,030 | $2,240 | $20,790 |
| 2013 | $709 | $17,120 | $2,140 | $14,980 |
Source: Public Records
Map
Nearby Homes
- 115 Marshall St
- 99 Marshall St
- 121 Marshall St
- 108 Poplar St
- 127 Marshall St
- 112 Poplar St
- 112 Marshall St
- 19 Marshall St Unit 19
- 104 Marshall St
- 120 Marshall St
- 118 Poplar St
- 124 Marshall St
- 96 Marshall St
- 100 Marshall St
- 133 Marshall St
- 124 Poplar St
- 128 Marshall St
- 387 Harper St
- 109 Poplar St
- 132 Marshall St
Your Personal Tour Guide
Ask me questions while you tour the home.