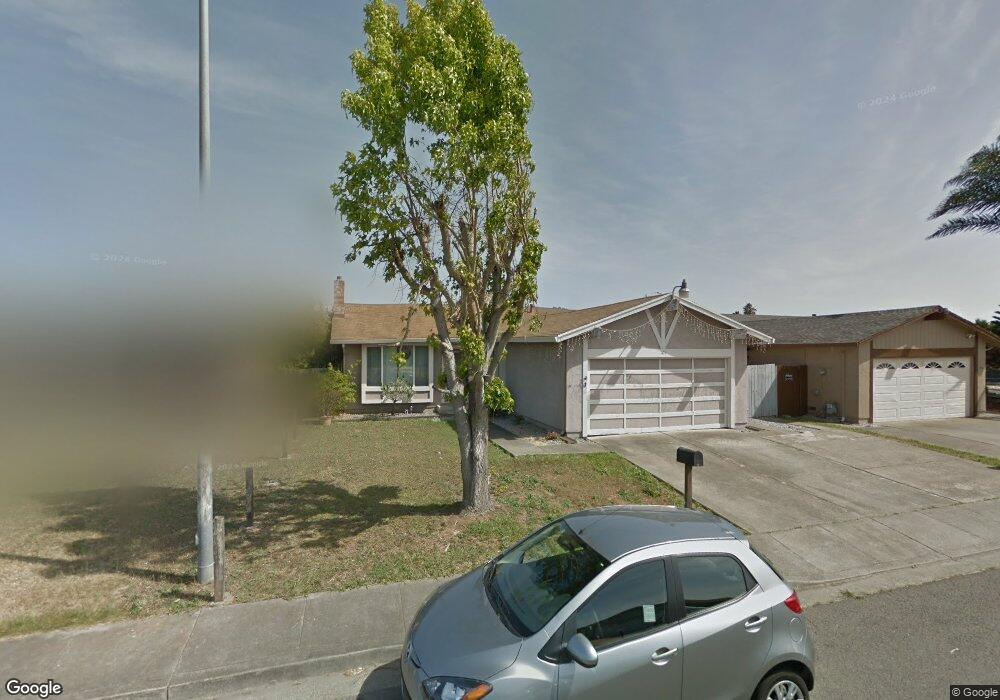
109 Martel Ct Vallejo, CA 94589
North Vallejo NeighborhoodEstimated Value: $460,000 - $503,000
3
Beds
2
Baths
1,144
Sq Ft
$426/Sq Ft
Est. Value
About This Home
This home is located at 109 Martel Ct, Vallejo, CA 94589 and is currently estimated at $487,796, approximately $426 per square foot. 109 Martel Ct is a home located in Solano County with nearby schools including Dan Mini Elementary School, Solano Middle School, and Vallejo High School.
Ownership History
Date
Name
Owned For
Owner Type
Purchase Details
Closed on
Mar 23, 2005
Sold by
Moreno Reyes Loretta and Reyes Douglas
Bought by
Abad Eduardo P and Abad Yolanda G
Current Estimated Value
Home Financials for this Owner
Home Financials are based on the most recent Mortgage that was taken out on this home.
Original Mortgage
$304,000
Outstanding Balance
$150,431
Interest Rate
5.25%
Mortgage Type
Purchase Money Mortgage
Estimated Equity
$337,365
Purchase Details
Closed on
Apr 5, 2002
Sold by
Moreno Reyes Loretta
Bought by
Moreno Reyes Loretta and Reyes Douglas
Purchase Details
Closed on
Jun 19, 1998
Sold by
Richard Reyes
Bought by
Reyes Loretta Moreno
Home Financials for this Owner
Home Financials are based on the most recent Mortgage that was taken out on this home.
Original Mortgage
$84,000
Interest Rate
7.17%
Create a Home Valuation Report for This Property
The Home Valuation Report is an in-depth analysis detailing your home's value as well as a comparison with similar homes in the area
Home Values in the Area
Average Home Value in this Area
Purchase History
| Date | Buyer | Sale Price | Title Company |
|---|---|---|---|
| Abad Eduardo P | $380,000 | Chicago Title Co | |
| Moreno Reyes Loretta | $75,000 | -- | |
| Reyes Loretta Moreno | -- | -- |
Source: Public Records
Mortgage History
| Date | Status | Borrower | Loan Amount |
|---|---|---|---|
| Open | Abad Eduardo P | $304,000 | |
| Previous Owner | Reyes Loretta Moreno | $84,000 |
Source: Public Records
Tax History
| Year | Tax Paid | Tax Assessment Tax Assessment Total Assessment is a certain percentage of the fair market value that is determined by local assessors to be the total taxable value of land and additions on the property. | Land | Improvement |
|---|---|---|---|---|
| 2025 | $6,648 | $487,199 | $58,000 | $429,199 |
| 2024 | $6,648 | $487,199 | $58,000 | $429,199 |
| 2023 | $6,415 | $487,199 | $58,000 | $429,199 |
| 2022 | $6,449 | $487,199 | $58,000 | $429,199 |
| 2021 | $5,650 | $420,000 | $54,000 | $366,000 |
| 2020 | $5,310 | $383,000 | $53,000 | $330,000 |
| 2019 | $5,098 | $370,000 | $55,000 | $315,000 |
| 2018 | $4,829 | $367,000 | $58,000 | $309,000 |
| 2017 | $3,894 | $294,000 | $49,000 | $245,000 |
| 2016 | $3,152 | $273,000 | $49,000 | $224,000 |
| 2015 | $2,748 | $237,000 | $43,000 | $194,000 |
| 2014 | $2,224 | $190,000 | $36,000 | $154,000 |
Source: Public Records
Map
Nearby Homes
- 1335 Jack London Dr
- 1355 Jack London Dr
- 570 Newport Way
- 552 Cattail Ct
- 568 Cattail Ct
- 148 Obrien Cir
- 1001 Jack London Dr
- 1900 Alice Dr
- 446 Kensington Way
- 240 Rinaldo Dr
- 35 Marla Dr
- 601 Danrose Dr
- 705 Danrose Dr
- 116 Bret Harte Way
- 203 Baylor Dr Unit 11
- 301 Baylor Dr
- 151 Marquette Ave
- 444 Corcoran Ave Unit 4
- 137 Hastings Ave
- 2350 Elliott Dr
Your Personal Tour Guide
Ask me questions while you tour the home.