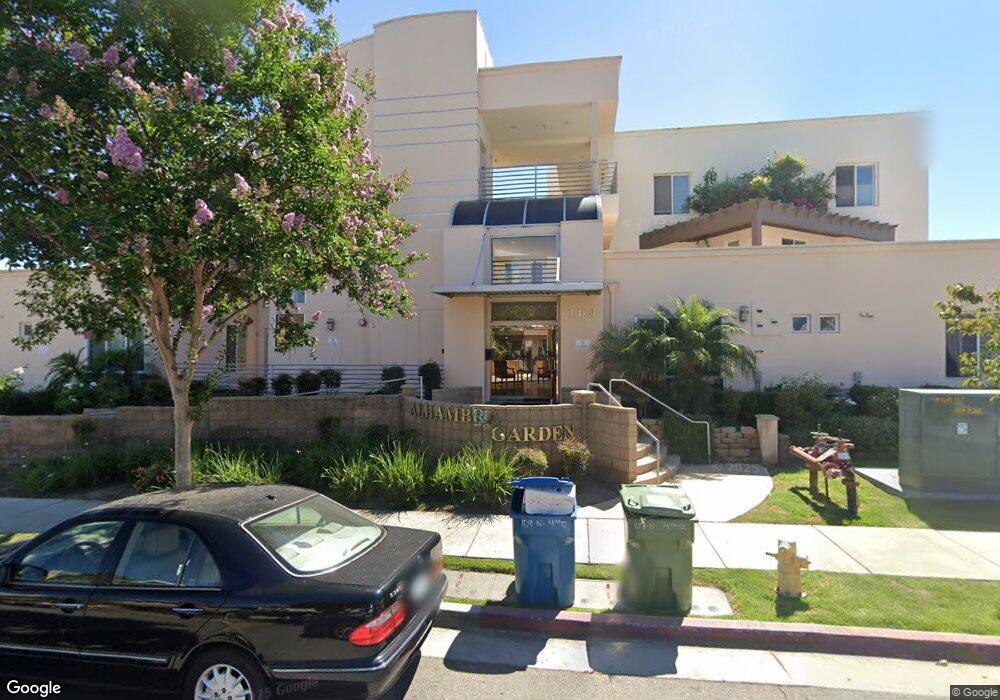
109 N 4th St Unit 109 Alhambra, CA 91801
Estimated Value: $568,000 - $602,000
2
Beds
2
Baths
964
Sq Ft
$608/Sq Ft
Est. Value
About This Home
This home is located at 109 N 4th St Unit 109, Alhambra, CA 91801 and is currently estimated at $586,191, approximately $608 per square foot. 109 N 4th St Unit 109 is a home located in Los Angeles County with nearby schools including Garfield Elementary School, Alhambra High School, and All Souls World Language Catholic School.
Ownership History
Date
Name
Owned For
Owner Type
Purchase Details
Closed on
Aug 6, 2007
Sold by
Alhambra Garden Estate Llc
Bought by
Clary Donald B
Current Estimated Value
Home Financials for this Owner
Home Financials are based on the most recent Mortgage that was taken out on this home.
Original Mortgage
$304,000
Outstanding Balance
$189,605
Interest Rate
6.37%
Mortgage Type
Purchase Money Mortgage
Estimated Equity
$396,586
Purchase Details
Closed on
Dec 8, 2003
Sold by
Watanasirisuk Somchal
Bought by
J & L Holding Llc
Purchase Details
Closed on
Nov 19, 2002
Sold by
Chu Dung Chi
Bought by
Watanasirisuk Saipin and Watanasirisuk Somchai
Purchase Details
Closed on
Nov 21, 2000
Sold by
Phillips Joy J
Bought by
Chu Dung Chi and Li Qing Xiao
Home Financials for this Owner
Home Financials are based on the most recent Mortgage that was taken out on this home.
Original Mortgage
$244,000
Interest Rate
7.86%
Mortgage Type
Seller Take Back
Create a Home Valuation Report for This Property
The Home Valuation Report is an in-depth analysis detailing your home's value as well as a comparison with similar homes in the area
Home Values in the Area
Average Home Value in this Area
Purchase History
| Date | Buyer | Sale Price | Title Company |
|---|---|---|---|
| Clary Donald B | $380,000 | Cctc | |
| J & L Holding Llc | -- | First American Title Co Los | |
| Watanasirisuk Saipin | -- | Stewart Title | |
| Chu Dung Chi | $305,000 | Investors Title Company |
Source: Public Records
Mortgage History
| Date | Status | Borrower | Loan Amount |
|---|---|---|---|
| Open | Clary Donald B | $304,000 | |
| Previous Owner | Chu Dung Chi | $244,000 |
Source: Public Records
Tax History Compared to Growth
Tax History
| Year | Tax Paid | Tax Assessment Tax Assessment Total Assessment is a certain percentage of the fair market value that is determined by local assessors to be the total taxable value of land and additions on the property. | Land | Improvement |
|---|---|---|---|---|
| 2025 | $6,062 | $499,123 | $299,476 | $199,647 |
| 2024 | $6,062 | $489,337 | $293,604 | $195,733 |
| 2023 | $5,998 | $479,744 | $287,848 | $191,896 |
| 2022 | $5,706 | $470,338 | $282,204 | $188,134 |
| 2021 | $5,647 | $461,117 | $276,671 | $184,446 |
| 2019 | $5,446 | $447,442 | $268,466 | $178,976 |
| 2018 | $5,490 | $438,669 | $263,202 | $175,467 |
| 2016 | $4,672 | $388,000 | $241,000 | $147,000 |
| 2015 | $4,667 | $388,000 | $241,000 | $147,000 |
| 2014 | $4,411 | $363,000 | $225,200 | $137,800 |
Source: Public Records
Map
Nearby Homes
- 200 N 5th St Unit 311
- 200 N 5th St Unit 108
- 200 N 5th St Unit 101
- 210 N Atlantic Blvd Unit A
- 410 W Main St Unit 231
- 1217 Saint Charles Terrace
- 501 N Olive Ave
- 304 N Marguerita Ave Unit C
- 111 N Marguerita Ave
- 1412 Larch St
- 22 N Electric Ave
- 212 N Stoneman Ave Unit E
- 213 S Atlantic Blvd
- 78 E Bay State St Unit 1E
- 88 E Bay State St Unit 1F
- 210 N Monterey St Unit 208
- 228 S Olive Ave Unit A302
- 806 W Commonwealth Ave Unit 14
- 125 N Bushnell Ave
- Plan PB-1 at Monterey Bay Square
- 109 N 4th St Unit 104
- 109 N 4th St Unit 204
- 109 N 4th St Unit 315
- 109 N 4th St Unit 215
- 109 N 4th St Unit 105
- 109 N 4th St Unit 103
- 109 N 4th St Unit 110
- 109 N 4th St Unit 102
- 109 N 4th St Unit 309
- 109 N 4th St Unit 306
- 109 N 4th St Unit 202
- 109 N 4th St Unit 205
- 109 N 4th St Unit 111
- 109 N 4th St Unit 101
- 109 N 4th St Unit 108
- 109 N 4th St Unit 310
- 109 N 4th St Unit 308
- 109 N 4th St Unit 307
- 109 N 4th St Unit 305
- 109 N 4th St Unit 302