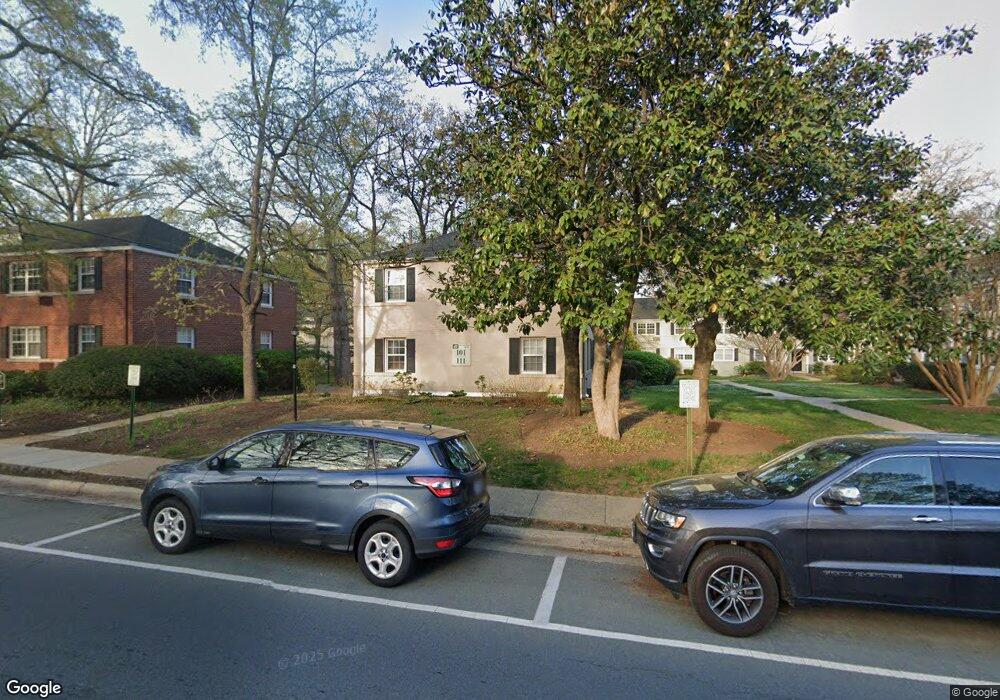
109 N George Mason Dr Unit 1091 Arlington, VA 22203
Buckingham NeighborhoodEstimated Value: $507,000 - $638,000
3
Beds
2
Baths
1,620
Sq Ft
$348/Sq Ft
Est. Value
About This Home
This home is located at 109 N George Mason Dr Unit 1091, Arlington, VA 22203 and is currently estimated at $564,325, approximately $348 per square foot. 109 N George Mason Dr Unit 1091 is a home located in Arlington County with nearby schools including Barrett Elementary School, Swanson Middle School, and Washington Liberty High School.
Ownership History
Date
Name
Owned For
Owner Type
Purchase Details
Closed on
May 28, 2009
Sold by
Thurston G Stephen
Bought by
Sumner Roberta
Current Estimated Value
Home Financials for this Owner
Home Financials are based on the most recent Mortgage that was taken out on this home.
Original Mortgage
$382,900
Outstanding Balance
$243,223
Interest Rate
4.87%
Mortgage Type
FHA
Estimated Equity
$321,102
Purchase Details
Closed on
Nov 13, 1998
Sold by
Bratt Michael H
Bought by
Thurston G Stephen
Home Financials for this Owner
Home Financials are based on the most recent Mortgage that was taken out on this home.
Original Mortgage
$121,500
Interest Rate
6.49%
Purchase Details
Closed on
Sep 12, 1995
Sold by
Arlington Oaks Community Assn
Bought by
Bratt Michael H
Home Financials for this Owner
Home Financials are based on the most recent Mortgage that was taken out on this home.
Original Mortgage
$97,994
Interest Rate
7.8%
Create a Home Valuation Report for This Property
The Home Valuation Report is an in-depth analysis detailing your home's value as well as a comparison with similar homes in the area
Home Values in the Area
Average Home Value in this Area
Purchase History
| Date | Buyer | Sale Price | Title Company |
|---|---|---|---|
| Sumner Roberta | $390,000 | -- | |
| Thurston G Stephen | $135,000 | -- | |
| Bratt Michael H | $115,400 | -- |
Source: Public Records
Mortgage History
| Date | Status | Borrower | Loan Amount |
|---|---|---|---|
| Open | Sumner Roberta | $382,900 | |
| Previous Owner | Thurston G Stephen | $121,500 | |
| Previous Owner | Bratt Michael H | $97,994 |
Source: Public Records
Tax History Compared to Growth
Tax History
| Year | Tax Paid | Tax Assessment Tax Assessment Total Assessment is a certain percentage of the fair market value that is determined by local assessors to be the total taxable value of land and additions on the property. | Land | Improvement |
|---|---|---|---|---|
| 2025 | $5,164 | $499,900 | $99,700 | $400,200 |
| 2024 | $5,005 | $484,500 | $99,700 | $384,800 |
| 2023 | $5,199 | $504,800 | $99,700 | $405,100 |
| 2022 | $4,624 | $448,900 | $99,700 | $349,200 |
| 2021 | $5,023 | $487,700 | $99,700 | $388,000 |
| 2020 | $4,340 | $423,000 | $72,500 | $350,500 |
| 2019 | $4,201 | $409,500 | $72,500 | $337,000 |
| 2018 | $3,927 | $390,400 | $72,500 | $317,900 |
| 2017 | $3,896 | $387,300 | $72,500 | $314,800 |
| 2016 | $3,431 | $346,200 | $72,500 | $273,700 |
| 2015 | $3,448 | $346,200 | $72,500 | $273,700 |
| 2014 | $3,448 | $346,200 | $72,500 | $273,700 |
Source: Public Records
Map
Nearby Homes
- 231 N Thomas St Unit 105
- 4501 Arlington Blvd Unit 707
- 3851 2nd St N
- 102 S Glebe Rd
- 24 S Abingdon St
- 4141 N Henderson Rd Unit 107
- 4141 N Henderson Rd Unit 809
- 4141 N Henderson Rd Unit 702
- 4141 N Henderson Rd Unit 303
- 205 S Pershing Dr
- 4810 3rd St N
- 3726 3rd St S
- 3701 5th St S Unit 406
- 3701 5th St S Unit 212
- 3720 5th St S
- 3919 7th St S
- 3601 5th St S Unit 206
- 4223 N Carlin Springs Rd
- 217 N Emerson St
- 820 N Pollard St Unit 810
- 109 N George Mason Dr Unit 1092
- 109 N George Mason Dr Unit 2
- 111 N George Mason Dr Unit 1112
- 111 N George Mason Dr Unit 1111
- 111 N George Mason Dr Unit 1
- 107 N George Mason Dr Unit 1071
- 107 N George Mason Dr Unit 1073
- 107 N George Mason Dr Unit 1074
- 107 N George Mason Dr Unit 1072
- 107 N George Mason Dr Unit 3
- 103 N George Mason Dr Unit 1031
- 103 N George Mason Dr Unit 1032
- 103 N George Mason Dr Unit 1-103
- 201 N George Mason Dr Unit 1
- 201 N George Mason Dr Unit 2012
- 201 N George Mason Dr Unit 2013
- 201 N George Mason Dr Unit 2014
- 201 N George Mason Dr Unit 2011
- 105 N George Mason Dr Unit 1051
- 105 N George Mason Dr Unit 1053