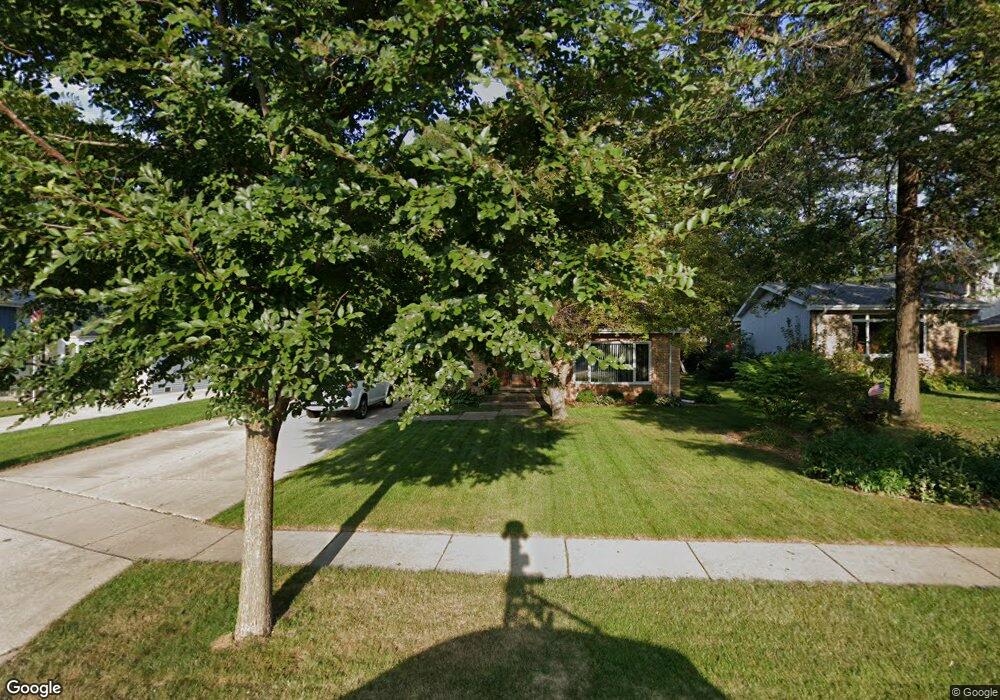
109 N Western Ave Bartlett, IL 60103
Estimated Value: $406,000 - $474,000
4
Beds
3
Baths
2,148
Sq Ft
$210/Sq Ft
Est. Value
About This Home
This home is located at 109 N Western Ave, Bartlett, IL 60103 and is currently estimated at $451,851, approximately $210 per square foot. 109 N Western Ave is a home located in Cook County with nearby schools including Bartlett Elementary School, Eastview Middle School, and South Elgin High School.
Ownership History
Date
Name
Owned For
Owner Type
Purchase Details
Closed on
Aug 30, 2005
Sold by
Cendant Mobility Financial Corp
Bought by
Jensen Paul B and Trujillo Jensen Rebecca A
Current Estimated Value
Home Financials for this Owner
Home Financials are based on the most recent Mortgage that was taken out on this home.
Original Mortgage
$327,500
Outstanding Balance
$176,971
Interest Rate
6.01%
Mortgage Type
Fannie Mae Freddie Mac
Estimated Equity
$274,880
Purchase Details
Closed on
May 10, 2005
Sold by
Willis Vincent and Willis Lorraine
Bought by
Cendant Mobility Financial Corp
Purchase Details
Closed on
Jul 23, 2001
Sold by
Sinnes Jay R and Sinnes Pattie S
Bought by
Wilis Vincent and Willis Lorriane
Home Financials for this Owner
Home Financials are based on the most recent Mortgage that was taken out on this home.
Original Mortgage
$207,950
Interest Rate
7.16%
Purchase Details
Closed on
Dec 28, 1993
Sold by
American National Bk & Tr Co Of Chicago
Bought by
Sinnes Jay R and Sinnes Pattie S
Home Financials for this Owner
Home Financials are based on the most recent Mortgage that was taken out on this home.
Original Mortgage
$96,000
Interest Rate
7.35%
Create a Home Valuation Report for This Property
The Home Valuation Report is an in-depth analysis detailing your home's value as well as a comparison with similar homes in the area
Home Values in the Area
Average Home Value in this Area
Purchase History
| Date | Buyer | Sale Price | Title Company |
|---|---|---|---|
| Jensen Paul B | $327,500 | -- | |
| Cendant Mobility Financial Corp | $335,000 | -- | |
| Wilis Vincent | $260,000 | 1St American Title | |
| Sinnes Jay R | -- | -- |
Source: Public Records
Mortgage History
| Date | Status | Borrower | Loan Amount |
|---|---|---|---|
| Open | Jensen Paul B | $327,500 | |
| Previous Owner | Wilis Vincent | $207,950 | |
| Previous Owner | Sinnes Jay R | $96,000 |
Source: Public Records
Tax History Compared to Growth
Tax History
| Year | Tax Paid | Tax Assessment Tax Assessment Total Assessment is a certain percentage of the fair market value that is determined by local assessors to be the total taxable value of land and additions on the property. | Land | Improvement |
|---|---|---|---|---|
| 2024 | $10,345 | $36,001 | $4,793 | $31,208 |
| 2023 | $9,964 | $36,001 | $4,793 | $31,208 |
| 2022 | $9,964 | $36,001 | $4,793 | $31,208 |
| 2021 | $8,266 | $25,575 | $4,073 | $21,502 |
| 2020 | $8,239 | $25,575 | $4,073 | $21,502 |
| 2019 | $8,298 | $28,736 | $4,073 | $24,663 |
| 2018 | $9,133 | $28,983 | $3,594 | $25,389 |
| 2017 | $9,000 | $28,983 | $3,594 | $25,389 |
| 2016 | $8,692 | $28,983 | $3,594 | $25,389 |
| 2015 | $8,211 | $25,775 | $3,115 | $22,660 |
| 2014 | $8,126 | $25,775 | $3,115 | $22,660 |
| 2013 | $7,794 | $25,775 | $3,115 | $22,660 |
Source: Public Records
Map
Nearby Homes
- 109 S Western Ave
- 403 W Oneida Ave
- 401 W Oneida Ave
- 215 N Oak Ave
- 245 Little John Ct
- 271 E Railroad Ave Unit 302
- 275 E Railroad Ave Unit 301
- 238 S Devon Ave
- 420 Ford Ln
- 368 Pinoak Dr
- 119 E Railroad Ave
- 110 N Chase Ave
- 105 N Chase Ave
- 150 Shady Ln
- 4077 Club Tree Dr
- 3075 Kingston Ct
- 130 Regency Dr
- 600 W Lake St
- 3098 Lynnwood Ct
- 650 W Old Lake St
- 105 N Western Ave
- 113 N Western Ave
- 101 N Western Ave
- 108 N Western Ave
- 316 W North Ave
- 119 N Western Ave
- 104 N Western Ave
- 310 W North Ave
- 409 Church Ct
- 304 W North Ave
- 116 N Western Ave
- 326 W North Ave
- 410 W North Ave
- 329 W North Ave
- 410 Church Ct
- 315 W North Ave
- 415 Church Ct
- 110 N Hickory Ave
- 315 W Morse Ave
- 104 N Hickory Ave