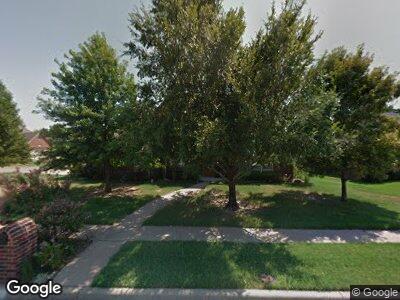
109 N Yellowood Ave Broken Arrow, OK 74012
Country Aire Estates NeighborhoodEstimated Value: $350,314 - $397,000
--
Bed
4
Baths
3,013
Sq Ft
$125/Sq Ft
Est. Value
About This Home
This home is located at 109 N Yellowood Ave, Broken Arrow, OK 74012 and is currently estimated at $375,579, approximately $124 per square foot. 109 N Yellowood Ave is a home located in Tulsa County with nearby schools including Marshall T. Moore Elementary School, Union 8th Grade Center, and Union 6th-7th Grade Center.
Ownership History
Date
Name
Owned For
Owner Type
Purchase Details
Closed on
Dec 15, 1999
Sold by
Lexmark Homes Inc
Bought by
Inderrieden John D and Inderrieden Margaret S
Current Estimated Value
Home Financials for this Owner
Home Financials are based on the most recent Mortgage that was taken out on this home.
Original Mortgage
$175,250
Interest Rate
7.69%
Mortgage Type
Purchase Money Mortgage
Purchase Details
Closed on
Apr 30, 1999
Sold by
American Land 71St Street Company
Bought by
Lexmark Homes Inc
Create a Home Valuation Report for This Property
The Home Valuation Report is an in-depth analysis detailing your home's value as well as a comparison with similar homes in the area
Home Values in the Area
Average Home Value in this Area
Purchase History
| Date | Buyer | Sale Price | Title Company |
|---|---|---|---|
| Inderrieden John D | $219,500 | Tulsa Abstract & Title Co | |
| Lexmark Homes Inc | $36,500 | -- |
Source: Public Records
Mortgage History
| Date | Status | Borrower | Loan Amount |
|---|---|---|---|
| Open | Inderrieden John D | $166,750 | |
| Closed | Inderrieden John D | $30,000 | |
| Closed | Inderrieden John D | $156,100 | |
| Closed | Inderrieden John D | $162,700 | |
| Closed | Inderrieden John D | $175,250 |
Source: Public Records
Tax History Compared to Growth
Tax History
| Year | Tax Paid | Tax Assessment Tax Assessment Total Assessment is a certain percentage of the fair market value that is determined by local assessors to be the total taxable value of land and additions on the property. | Land | Improvement |
|---|---|---|---|---|
| 2024 | $3,177 | $25,384 | $2,830 | $22,554 |
| 2023 | $3,177 | $25,616 | $2,867 | $22,749 |
| 2022 | $3,106 | $23,870 | $3,807 | $20,063 |
| 2021 | $3,022 | $23,145 | $3,691 | $19,454 |
| 2020 | $3,041 | $23,145 | $3,691 | $19,454 |
| 2019 | $3,037 | $23,145 | $3,691 | $19,454 |
| 2018 | $3,028 | $23,145 | $3,691 | $19,454 |
| 2017 | $3,068 | $24,145 | $3,850 | $20,295 |
| 2016 | $3,028 | $24,145 | $3,850 | $20,295 |
| 2015 | $3,029 | $24,145 | $3,850 | $20,295 |
| 2014 | $3,011 | $24,145 | $3,850 | $20,295 |
Source: Public Records
Map
Nearby Homes
- 4208 W Freeport St
- 3740 W Freeport St
- 4512 W Fort Worth St
- 3708 W Detroit St
- 708 N Aster Ave
- 301 N Eucalyptus Ct
- 3716 W Freeport St
- 200 S Firewood Ave
- 308 N Eucalyptus Ct
- 3843 W Galveston Place
- 715 N Butternut Ct
- 4932 W Commercial St
- 11130 E 75th Place
- 704 N Nyssa Ave
- 1101 N Aster Ave
- 619 S Magnolia Place
- 1012 S Willow Ave
- 3304 W Houston Place
- 1016 S Cypress Ave
- 1323 N Umbrella Ave
- 109 N Yellowood Ave
- 105 N Yellowood Ave
- 101 S Yellowood Ave
- 4301 W College St
- 4224 W College St
- 4217 W College St
- 4300 W Broadway St
- 4228 W College St
- 4220 W College St
- 103 S Yellowood Ave
- 4216 W College St
- 4305 W College St
- 4213 W College St
- 4304 W Broadway St
- 4300 W College St
- 4212 W College St
- 4225 W Detroit St
- 4221 W Detroit St
- 4301 W Broadway St
- 4309 W College St
