Estimated Value: $85,067 - $138,000
--
Bed
--
Bath
780
Sq Ft
$148/Sq Ft
Est. Value
About This Home
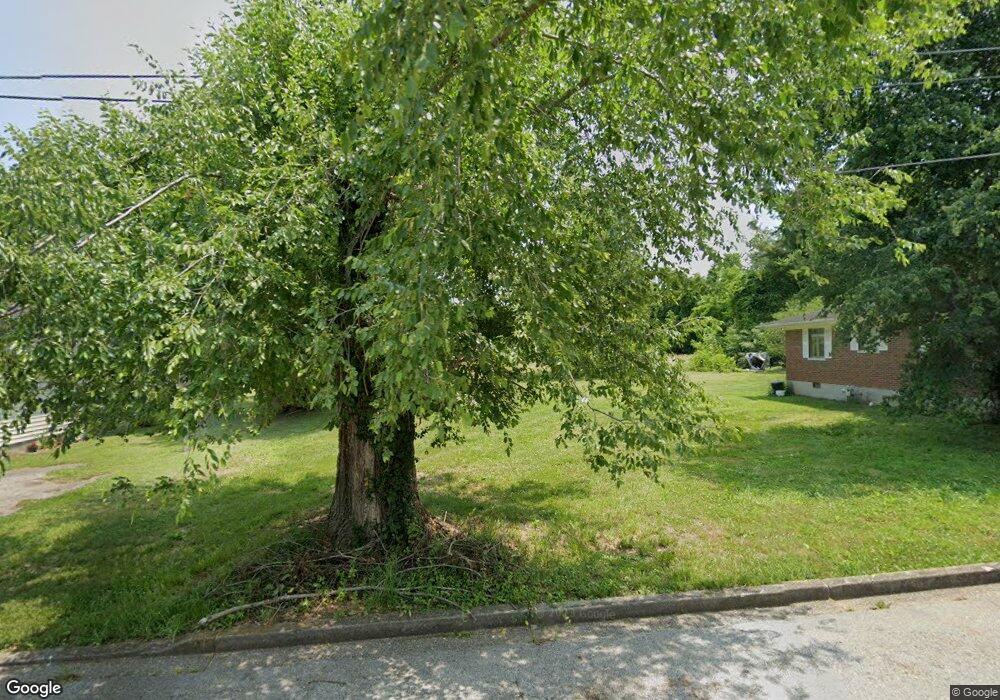
This home is located at 109 Orchard St, Berea, KY 40403 and is currently estimated at $115,767, approximately $148 per square foot. 109 Orchard St is a home with nearby schools including Berea Community Elementary School, Berea Community Middle School, and Berea Community High School.
Ownership History
Date
Name
Owned For
Owner Type
Purchase Details
Closed on
Aug 23, 2023
Sold by
Madison Circuit Court
Bought by
Mid South Capital Partners Lp and Powell
Current Estimated Value
Purchase Details
Closed on
Nov 4, 2022
Sold by
Combs Colt Llc
Bought by
Tucker Kelinda Aurelia
Purchase Details
Closed on
Oct 25, 2022
Sold by
Jones Gary
Bought by
Reese Janice and Reese Charles
Purchase Details
Closed on
Sep 13, 2022
Sold by
David J Williams Jr Testamentary Trust
Bought by
Commonwealth Of Kentucky and Justice And Public Safety Cabinet Department Of Criminal Jus
Purchase Details
Closed on
Sep 8, 2022
Sold by
Madison Circuit Court
Bought by
Mid South Capital Partners Lp and Commonwealth Of Kentucky
Purchase Details
Closed on
Aug 24, 2022
Sold by
Madison County
Bought by
Mid South Capital Partners Lp
Purchase Details
Closed on
Aug 12, 2021
Sold by
Madison County Circuit Court
Bought by
Mid South Capital Partners Lp
Create a Home Valuation Report for This Property
The Home Valuation Report is an in-depth analysis detailing your home's value as well as a comparison with similar homes in the area
Home Values in the Area
Average Home Value in this Area
Purchase History
| Date | Buyer | Sale Price | Title Company |
|---|---|---|---|
| Mid South Capital Partners Lp | $653,250 | None Listed On Document | |
| Tucker Kelinda Aurelia | $230,000 | Bluegrass Land Title | |
| Reese Janice | $75,000 | Imag Title | |
| Commonwealth Of Kentucky | $124,000,000 | -- | |
| Mid South Capital Partners Lp | $19,000 | -- | |
| Mid South Capital Partners Lp | $359 | None Listed On Document | |
| Mid South Capital Partners Lp | $578,920 | None Listed On Document |
Source: Public Records
Tax History Compared to Growth
Tax History
| Year | Tax Paid | Tax Assessment Tax Assessment Total Assessment is a certain percentage of the fair market value that is determined by local assessors to be the total taxable value of land and additions on the property. | Land | Improvement |
|---|---|---|---|---|
| 2024 | $177 | $15,000 | $0 | $0 |
| 2023 | $196 | $15,000 | $0 | $0 |
| 2022 | $381 | $30,000 | $0 | $0 |
| 2021 | $202 | $15,000 | $0 | $0 |
| 2020 | $579 | $44,000 | $0 | $0 |
| 2019 | $543 | $40,000 | $0 | $0 |
| 2018 | $533 | $40,000 | $0 | $0 |
| 2017 | $522 | $40,000 | $0 | $0 |
| 2016 | $508 | $40,000 | $0 | $0 |
| 2015 | $38 | $40,000 | $0 | $0 |
| 2014 | $77 | $40,000 | $0 | $0 |
| 2012 | $77 | $40,000 | $40,000 | $0 |
Source: Public Records
Map
Nearby Homes
- 122 Rogers St
- 601 Chestnut St
- 111 Holly St
- 200 S Broadway St
- 111 High St
- 87 Baldwin St
- 101 Baldwin St
- 118 Morning View Rd
- 185 Kaye St
- 115 Walnut St
- 120 Phillips St
- 363 Baldwin St
- 366 Baldwin St
- 13 Burchwood Dr
- 12 Burchwood Dr
- 361 Burchwood Dr
- 803 Slate Lick Rd
- 261 Paint Lick Rd
- 306 Prospect St
- 655-659 Scaffold Cane Rd