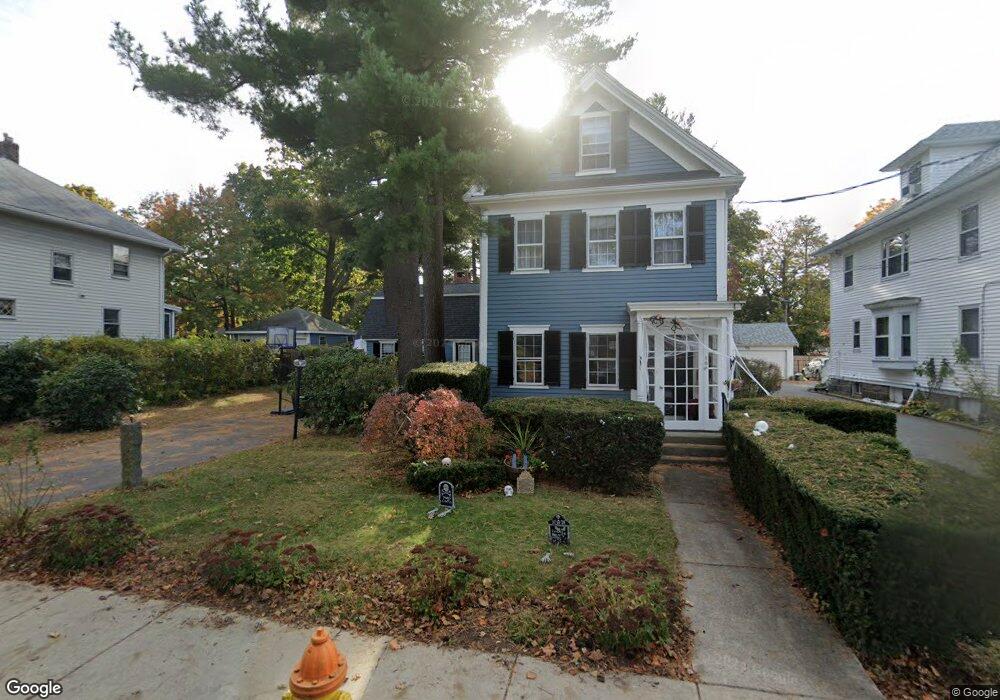
109 Putnam St Quincy, MA 02169
Quincy Center NeighborhoodEstimated Value: $844,000 - $1,017,000
4
Beds
3
Baths
1,907
Sq Ft
$471/Sq Ft
Est. Value
About This Home
This home is located at 109 Putnam St, Quincy, MA 02169 and is currently estimated at $898,000, approximately $470 per square foot. 109 Putnam St is a home located in Norfolk County with nearby schools including Merrymount Elementary School, Central Middle School, and Quincy High School.
Ownership History
Date
Name
Owned For
Owner Type
Purchase Details
Closed on
Jan 25, 2007
Sold by
109 Putnam Street T
Bought by
Mcconville John R and Mcconville Ruth A
Current Estimated Value
Home Financials for this Owner
Home Financials are based on the most recent Mortgage that was taken out on this home.
Original Mortgage
$342,000
Interest Rate
6.15%
Mortgage Type
Purchase Money Mortgage
Create a Home Valuation Report for This Property
The Home Valuation Report is an in-depth analysis detailing your home's value as well as a comparison with similar homes in the area
Home Values in the Area
Average Home Value in this Area
Purchase History
| Date | Buyer | Sale Price | Title Company |
|---|---|---|---|
| Mcconville John R | $427,500 | -- |
Source: Public Records
Mortgage History
| Date | Status | Borrower | Loan Amount |
|---|---|---|---|
| Open | Mcconville John R | $347,201 | |
| Closed | Mcconville John R | $342,000 |
Source: Public Records
Tax History Compared to Growth
Tax History
| Year | Tax Paid | Tax Assessment Tax Assessment Total Assessment is a certain percentage of the fair market value that is determined by local assessors to be the total taxable value of land and additions on the property. | Land | Improvement |
|---|---|---|---|---|
| 2025 | $8,197 | $710,900 | $319,900 | $391,000 |
| 2024 | $7,763 | $688,800 | $305,300 | $383,500 |
| 2023 | $7,084 | $636,500 | $278,700 | $357,800 |
| 2022 | $7,113 | $593,700 | $254,500 | $339,200 |
| 2021 | $7,062 | $581,700 | $254,500 | $327,200 |
| 2020 | $6,834 | $549,800 | $242,900 | $306,900 |
| 2019 | $6,545 | $521,500 | $229,900 | $291,600 |
| 2018 | $6,597 | $494,500 | $229,900 | $264,600 |
| 2017 | $6,605 | $466,100 | $219,600 | $246,500 |
| 2016 | $6,297 | $438,500 | $209,700 | $228,800 |
| 2015 | $6,139 | $420,500 | $209,700 | $210,800 |
| 2014 | $5,709 | $384,200 | $200,300 | $183,900 |
Source: Public Records
Map
Nearby Homes
- 20 Whitney Rd Unit 4
- 20 Whitney Rd Unit 2
- 20 Whitney Rd Unit 1
- 1 Adams St Unit 707
- 74 Butler Rd
- 1025 Hancock St Unit 2K
- 20 Putnam St
- 10 Presidents Ln Unit 10
- 14 Samoset Ave
- 45 Oval Rd Unit 6
- 200 Adams St
- 59 Spear St Unit 302
- 59 Spear St Unit 301
- 59 Spear St Unit 202
- 66 Mcgrath Hwy Unit 407
- 66 Mcgrath Hwy Unit 405
- 66 Mcgrath Hwy Unit 308
- 66 Mcgrath Hwy Unit 303
- 66 Mcgrath Hwy Unit 508
- 105 Sea St Unit 301
- 115 Putnam St
- 115 Putnam St Unit 2
- 103 Putnam St
- 119 Putnam St
- 99 Putnam St
- 101 Putnam St
- 43 Merrymount Rd Unit 9
- 43 Merrymount Rd Unit 8
- 43 Merrymount Rd Unit 7
- 43 Merrymount Rd Unit 6
- 43 Merrymount Rd Unit 5
- 43 Merrymount Rd Unit 4
- 43 Merrymount Rd Unit 3
- 43 Merrymount Rd Unit 2
- 43 Merrymount Rd Unit 14
- 43 Merrymount Rd Unit 13
- 43 Merrymount Rd Unit 12
- 43 Merrymount Rd Unit 11
- 43 Merrymount Rd Unit 10
- 43 Merrymount Rd Unit 1