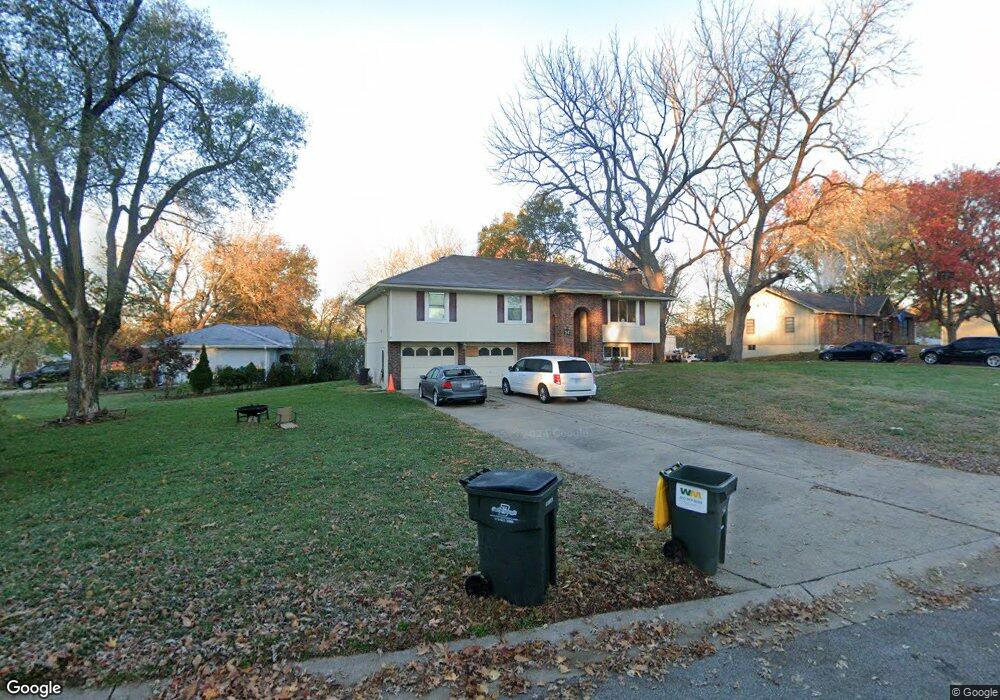
109 Ralph Dr Lansing, KS 66043
Estimated Value: $270,088 - $290,000
3
Beds
3
Baths
1,384
Sq Ft
$204/Sq Ft
Est. Value
About This Home
This home is located at 109 Ralph Dr, Lansing, KS 66043 and is currently estimated at $282,522, approximately $204 per square foot. 109 Ralph Dr is a home located in Leavenworth County with nearby schools including Lansing Elementary School, Lansing Middle 6-8, and Lansing High 9-12.
Ownership History
Date
Name
Owned For
Owner Type
Purchase Details
Closed on
Sep 28, 2017
Sold by
Connel Michael R
Bought by
Amos David
Current Estimated Value
Home Financials for this Owner
Home Financials are based on the most recent Mortgage that was taken out on this home.
Original Mortgage
$171,612
Outstanding Balance
$143,613
Interest Rate
3.89%
Mortgage Type
VA
Estimated Equity
$138,909
Create a Home Valuation Report for This Property
The Home Valuation Report is an in-depth analysis detailing your home's value as well as a comparison with similar homes in the area
Home Values in the Area
Average Home Value in this Area
Purchase History
| Date | Buyer | Sale Price | Title Company |
|---|---|---|---|
| Amos David | $168,179 | Premier Title Ks Inc |
Source: Public Records
Mortgage History
| Date | Status | Borrower | Loan Amount |
|---|---|---|---|
| Open | Amos David | $171,612 |
Source: Public Records
Tax History
| Year | Tax Paid | Tax Assessment Tax Assessment Total Assessment is a certain percentage of the fair market value that is determined by local assessors to be the total taxable value of land and additions on the property. | Land | Improvement |
|---|---|---|---|---|
| 2025 | $3,731 | $29,171 | $5,842 | $23,329 |
| 2024 | $3,473 | $28,049 | $4,658 | $23,391 |
| 2023 | $3,473 | $26,932 | $4,658 | $22,274 |
| 2022 | $3,340 | $24,484 | $3,809 | $20,675 |
| 2021 | $3,004 | $20,962 | $3,809 | $17,153 |
| 2020 | $2,907 | $19,964 | $3,809 | $16,155 |
| 2019 | $2,815 | $19,320 | $3,809 | $15,511 |
| 2018 | $2,814 | $19,320 | $3,212 | $16,108 |
| 2017 | $2,473 | $16,978 | $3,212 | $13,766 |
| 2016 | $2,449 | $16,810 | $3,212 | $13,598 |
| 2015 | $2,442 | $16,810 | $3,212 | $13,598 |
| 2014 | $2,391 | $16,810 | $3,212 | $13,598 |
Source: Public Records
Map
Nearby Homes
- 130 Hampton Ct
- 20958 Ida St
- 530 Holiday Ct
- 950 Holiday Dr
- 00000 Brookwood St
- 900 Oakmont Dr
- 26731 147th St
- 1017 Pebble Beach Dr
- 124 S Main St
- 1101 Pebble Beach Dr
- 202 S Main St
- Lot 2 Eisenhower Rd
- 114 Emile St
- 728 Eisenhower Rd
- 1015 Mount Calvary Rd
- 134 Debra St
- 1102 N Main St
- 218 E Kay St
- 811 4-H Rd
- 4 Eisenhower Rd
Your Personal Tour Guide
Ask me questions while you tour the home.