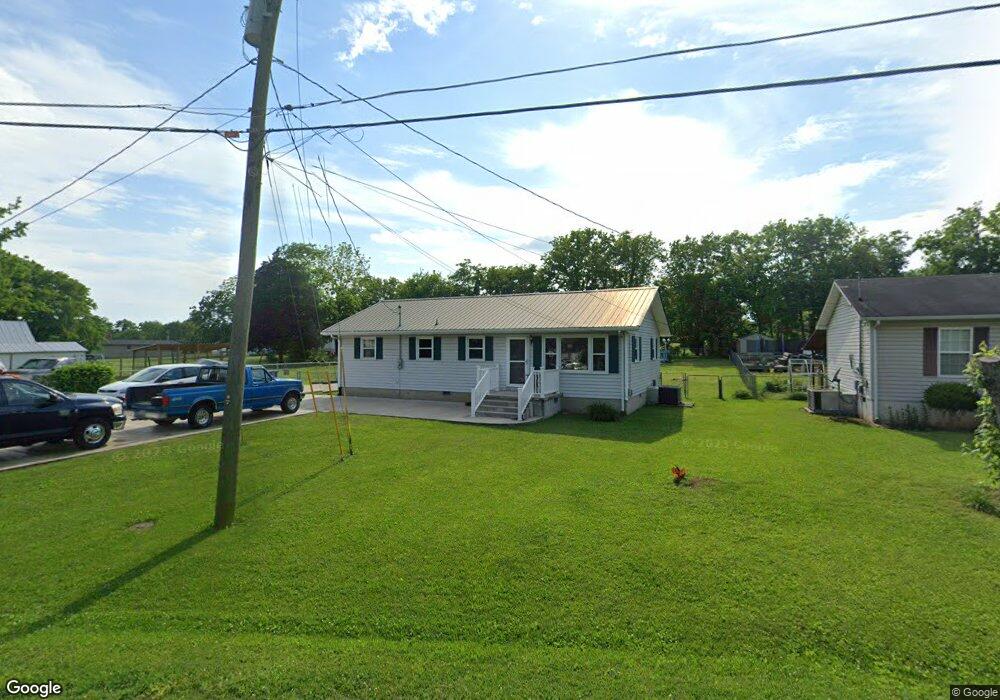
109 Ray St Shelbyville, TN 37160
Estimated Value: $194,678 - $257,000
--
Bed
2
Baths
1,196
Sq Ft
$181/Sq Ft
Est. Value
About This Home
This home is located at 109 Ray St, Shelbyville, TN 37160 and is currently estimated at $216,920, approximately $181 per square foot. 109 Ray St is a home located in Bedford County with nearby schools including Eakin Elementary School, Harris Middle School, and Victory Baptist Academy.
Ownership History
Date
Name
Owned For
Owner Type
Purchase Details
Closed on
Jun 10, 2010
Sold by
Daniel Phillip David
Bought by
Daniel Phillip David
Current Estimated Value
Purchase Details
Closed on
Jun 3, 2010
Sold by
Wilhoite Billy
Bought by
Daniel Phillip David
Purchase Details
Closed on
Dec 11, 2009
Sold by
Bank Of America National A
Bought by
Wilhoite Billy
Purchase Details
Closed on
Sep 21, 2009
Sold by
Dunn Eric
Bought by
Bank Of America National Assoc
Purchase Details
Closed on
Mar 18, 2009
Sold by
Dunn Eric C
Bought by
Dunn Eric C
Purchase Details
Closed on
Mar 12, 2001
Sold by
Phelps Carrie
Bought by
Bone Chad and Bone Becky
Purchase Details
Closed on
May 18, 1999
Sold by
Cleek Selina M
Bought by
Phelps Carrie
Purchase Details
Closed on
Jul 7, 1997
Sold by
Cleek Selina M
Bought by
Phelps Clifton N
Purchase Details
Closed on
Apr 10, 1988
Bought by
Cleek Selina M
Purchase Details
Closed on
Sep 10, 1961
Create a Home Valuation Report for This Property
The Home Valuation Report is an in-depth analysis detailing your home's value as well as a comparison with similar homes in the area
Home Values in the Area
Average Home Value in this Area
Purchase History
| Date | Buyer | Sale Price | Title Company |
|---|---|---|---|
| Daniel Phillip David | -- | -- | |
| Daniel Phillip David | $83,000 | -- | |
| Wilhoite Billy | $41,000 | -- | |
| Bank Of America National Assoc | $69,138 | -- | |
| Dunn Eric C | -- | -- | |
| Bone Chad | -- | -- | |
| Phelps Carrie | -- | -- | |
| Phelps Clifton N | $3,981 | -- | |
| Cleek Selina M | -- | -- | |
| -- | -- | -- |
Source: Public Records
Tax History Compared to Growth
Tax History
| Year | Tax Paid | Tax Assessment Tax Assessment Total Assessment is a certain percentage of the fair market value that is determined by local assessors to be the total taxable value of land and additions on the property. | Land | Improvement |
|---|---|---|---|---|
| 2025 | -- | $25,450 | $0 | $0 |
| 2024 | -- | $25,450 | $5,350 | $20,100 |
| 2023 | $377 | $25,450 | $5,350 | $20,100 |
| 2022 | $928 | $23,700 | $5,350 | $18,350 |
| 2021 | $843 | $23,700 | $5,350 | $18,350 |
| 2020 | $734 | $23,700 | $5,350 | $18,350 |
| 2019 | $734 | $16,575 | $2,375 | $14,200 |
| 2018 | $717 | $16,575 | $2,375 | $14,200 |
| 2017 | $717 | $16,575 | $2,375 | $14,200 |
| 2016 | $711 | $16,575 | $2,375 | $14,200 |
| 2015 | $711 | $16,575 | $2,375 | $14,200 |
| 2014 | $652 | $16,633 | $0 | $0 |
Source: Public Records
Map
Nearby Homes
- 1017 Fairfield Pike
- 112 E Cedar St
- 115 Scotland Heights
- 703 Deery St
- 134 Butler St
- 178 Lucas Rd
- 129 Annas Way
- 610 Sundance St
- 102 Saddlewood Dr
- 636 Deery St
- 216 Celebration St
- 0 Hilltop Rd Unit RTC2897754
- 0 Hilltop Rd Unit RTC3001632
- 724 Alton Ave
- 114 Collier Ave
- 304 Lee Ln
- 714 King Ave
- 713 King Ave
- 303 Lee Ln
- 201 Hickory Dr