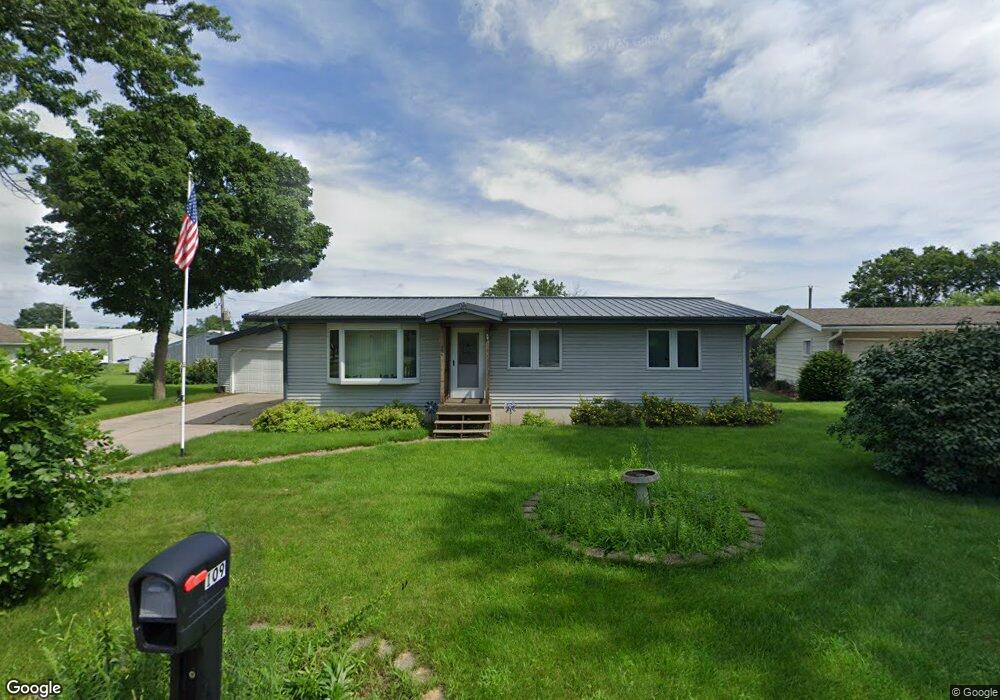
109 Rob Roy Ln Charles City, IA 50616
Estimated Value: $152,000 - $176,000
3
Beds
3
Baths
1,056
Sq Ft
$155/Sq Ft
Est. Value
About This Home
This home is located at 109 Rob Roy Ln, Charles City, IA 50616 and is currently estimated at $163,294, approximately $154 per square foot. 109 Rob Roy Ln is a home located in Floyd County with nearby schools including Charles City High School and Immaculate Conception School.
Ownership History
Date
Name
Owned For
Owner Type
Purchase Details
Closed on
Mar 4, 2009
Sold by
Hsbc Bank Usa N A
Bought by
Pattschull Teffany D
Current Estimated Value
Home Financials for this Owner
Home Financials are based on the most recent Mortgage that was taken out on this home.
Original Mortgage
$79,700
Outstanding Balance
$50,488
Interest Rate
5.14%
Mortgage Type
New Conventional
Estimated Equity
$112,806
Purchase Details
Closed on
Jan 11, 2009
Sold by
Shuman Benjamin P
Bought by
Hsbc Bank Usa N A
Home Financials for this Owner
Home Financials are based on the most recent Mortgage that was taken out on this home.
Original Mortgage
$79,700
Outstanding Balance
$50,488
Interest Rate
5.14%
Mortgage Type
New Conventional
Estimated Equity
$112,806
Purchase Details
Closed on
Nov 30, 2005
Sold by
Mayer Douglas V and Mayer Kathleen M
Bought by
Shuamn Benjamin P and Shuman Kenda A
Create a Home Valuation Report for This Property
The Home Valuation Report is an in-depth analysis detailing your home's value as well as a comparison with similar homes in the area
Home Values in the Area
Average Home Value in this Area
Purchase History
| Date | Buyer | Sale Price | Title Company |
|---|---|---|---|
| Pattschull Teffany D | $75,000 | None Available | |
| Hsbc Bank Usa N A | $93,517 | None Available | |
| Shuamn Benjamin P | $110,000 | None Available |
Source: Public Records
Mortgage History
| Date | Status | Borrower | Loan Amount |
|---|---|---|---|
| Open | Pattschull Teffany D | $79,700 |
Source: Public Records
Tax History Compared to Growth
Tax History
| Year | Tax Paid | Tax Assessment Tax Assessment Total Assessment is a certain percentage of the fair market value that is determined by local assessors to be the total taxable value of land and additions on the property. | Land | Improvement |
|---|---|---|---|---|
| 2025 | $2,258 | $144,310 | $13,440 | $130,870 |
| 2024 | $2,258 | $137,070 | $13,440 | $123,630 |
| 2023 | $2,082 | $137,070 | $13,440 | $123,630 |
| 2022 | $2,072 | $107,660 | $13,440 | $94,220 |
| 2021 | $2,094 | $107,660 | $13,440 | $94,220 |
| 2020 | $2,094 | $107,660 | $13,440 | $94,220 |
| 2019 | $2,034 | $107,130 | $11,520 | $95,610 |
| 2018 | $1,894 | $104,030 | $11,520 | $92,510 |
| 2017 | $1,924 | $104,030 | $11,520 | $92,510 |
| 2016 | $1,886 | $104,030 | $11,520 | $92,510 |
| 2015 | $1,886 | $103,500 | $11,520 | $91,980 |
| 2014 | $1,932 | $103,500 | $11,520 | $91,980 |
Source: Public Records
Map
Nearby Homes