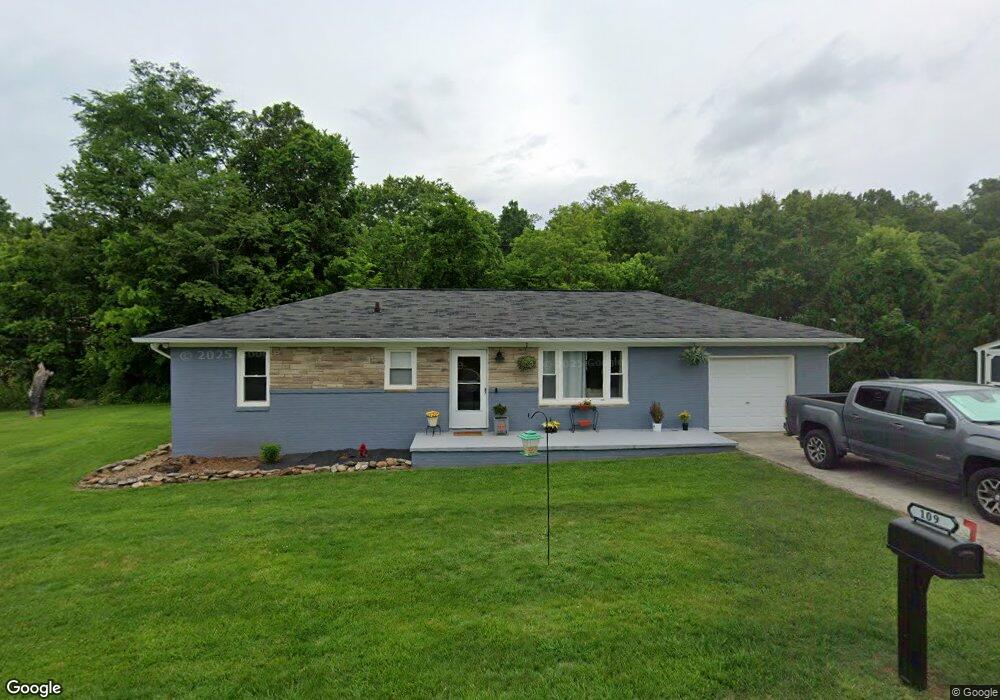
109 Robin Ln Bean Station, TN 37708
Estimated Value: $163,268 - $184,000
Studio
--
Bath
1,050
Sq Ft
$166/Sq Ft
Est. Value
About This Home
This home is located at 109 Robin Ln, Bean Station, TN 37708 and is currently estimated at $174,317, approximately $166 per square foot. 109 Robin Ln is a home with nearby schools including Bean Station Elementary School, Rutledge Middle School, and Grainger High School.
Ownership History
Date
Name
Owned For
Owner Type
Purchase Details
Closed on
Apr 17, 2025
Sold by
Long Donna G
Bought by
Kelley Jason W and Rainey Kelsea R
Current Estimated Value
Purchase Details
Closed on
Aug 2, 2024
Sold by
Fusselman Charlotte
Bought by
Long Donna G
Purchase Details
Closed on
Jul 15, 2024
Sold by
Fusselman Bible Danice I
Bought by
Fusselman Charlotte
Purchase Details
Closed on
Apr 7, 2017
Sold by
Fussellman Charlotte
Bought by
Fussellman Charlotte & Danice I Fussellman Bi
Purchase Details
Closed on
Sep 23, 2006
Sold by
Bible Mark
Bought by
Fusselman Bible Dance I
Purchase Details
Closed on
Jun 28, 1996
Sold by
Northern Harold Goldie
Bought by
Fusselman Danice I
Purchase Details
Closed on
Aug 5, 1993
Bought by
Northern Harold & Goldie
Purchase Details
Closed on
Apr 1, 1986
Bought by
Coffey Raymond
Purchase Details
Closed on
Mar 20, 1986
Create a Home Valuation Report for This Property
The Home Valuation Report is an in-depth analysis detailing your home's value as well as a comparison with similar homes in the area
Home Values in the Area
Average Home Value in this Area
Purchase History
| Date | Buyer | Sale Price | Title Company |
|---|---|---|---|
| Kelley Jason W | -- | None Listed On Document | |
| Kelley Jason W | -- | None Listed On Document | |
| Long Donna G | $150,000 | None Listed On Document | |
| Long Donna G | $150,000 | None Listed On Document | |
| Fusselman Charlotte | -- | None Listed On Document | |
| Fussellman Charlotte & Danice I Fussellman Bi | -- | -- | |
| Fusselman Bible Dance I | -- | -- | |
| Fusselman Danice I | $37,100 | -- | |
| Northern Harold & Goldie | $25,000 | -- | |
| Coffey Raymond | -- | -- | |
| -- | $1,000 | -- |
Source: Public Records
Tax History
| Year | Tax Paid | Tax Assessment Tax Assessment Total Assessment is a certain percentage of the fair market value that is determined by local assessors to be the total taxable value of land and additions on the property. | Land | Improvement |
|---|---|---|---|---|
| 2025 | $451 | $19,175 | $4,050 | $15,125 |
| 2024 | $451 | $19,175 | $4,050 | $15,125 |
| 2023 | $451 | $19,175 | $4,050 | $15,125 |
| 2022 | $440 | $19,175 | $4,050 | $15,125 |
| 2021 | $440 | $19,175 | $4,050 | $15,125 |
| 2020 | $445 | $19,175 | $4,050 | $15,125 |
| 2019 | $445 | $15,900 | $4,050 | $11,850 |
| 2018 | $385 | $15,900 | $4,050 | $11,850 |
| 2017 | $385 | $15,900 | $4,050 | $11,850 |
| 2016 | $385 | $15,900 | $4,050 | $11,850 |
| 2015 | $409 | $15,900 | $4,050 | $11,850 |
| 2014 | $409 | $16,359 | $0 | $0 |
Source: Public Records
Map
Nearby Homes
- 273 Bloomer Rd
- 223 Clearview Dr
- 300 Lakeview Cir
- 1245 County Line Rd
- 602 Kirkham Rd
- 171 Ellis St
- 138 Birdie Dr
- 2271 Broadway Dr
- 175 Lakeshore Dr
- 220 Phyllis Dr
- 280 Hickory St
- 415 Rocky Springs Rd
- 921 Rocky Summit Rd
- 188 Huntsman Ln
- 134 Circle Dr
- 254 Country Place
- 221 Hurst Hollow
- 420 Meadow Branch Rd
- 337 White Ln
- 1150 Oak Grove Rd
Your Personal Tour Guide
Ask me questions while you tour the home.