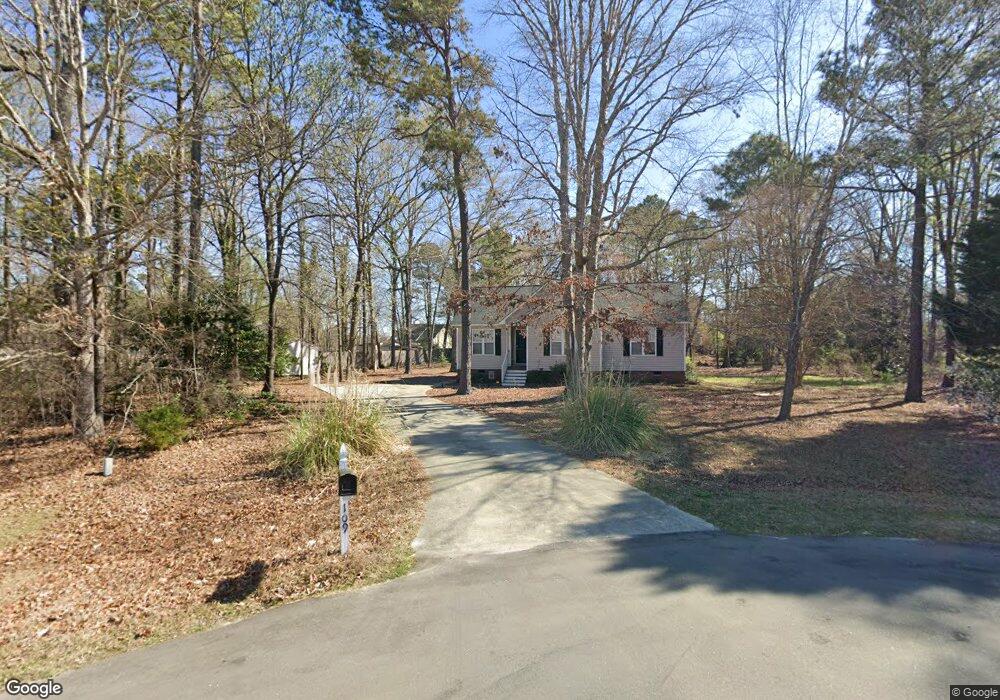
109 Rope Swing Cir Benson, NC 27504
Pleasant Grove NeighborhoodEstimated Value: $282,000 - $310,000
3
Beds
2
Baths
1,393
Sq Ft
$215/Sq Ft
Est. Value
About This Home
This home is located at 109 Rope Swing Cir, Benson, NC 27504 and is currently estimated at $299,258, approximately $214 per square foot. 109 Rope Swing Cir is a home located in Johnston County with nearby schools including McGee's Crossroads Elementary School, McGee's Crossroads Middle School, and West Johnston High School.
Ownership History
Date
Name
Owned For
Owner Type
Purchase Details
Closed on
Jul 21, 2020
Sold by
Sfr Jv Property Llc
Bought by
Sfr Jv 1 2020 1 Borrower Llc
Current Estimated Value
Home Financials for this Owner
Home Financials are based on the most recent Mortgage that was taken out on this home.
Original Mortgage
$601,428
Outstanding Balance
$534,296
Interest Rate
3.2%
Mortgage Type
Commercial
Estimated Equity
-$235,038
Purchase Details
Closed on
Jun 12, 2019
Sold by
Jones Rodney A and Jones Malisa D
Bought by
Sfr Jv 1 Property Llc
Purchase Details
Closed on
Apr 14, 2008
Sold by
Greijn Peter J and Greijn Diana L
Bought by
Jones Rodney A and Jones Malisa D
Home Financials for this Owner
Home Financials are based on the most recent Mortgage that was taken out on this home.
Original Mortgage
$128,700
Interest Rate
6.02%
Mortgage Type
Purchase Money Mortgage
Purchase Details
Closed on
Nov 21, 2003
Sold by
Greijn Peter J
Bought by
Wise Living Precepts Llc
Purchase Details
Closed on
May 29, 2003
Sold by
Household Realty Corp
Bought by
Howell William E
Create a Home Valuation Report for This Property
The Home Valuation Report is an in-depth analysis detailing your home's value as well as a comparison with similar homes in the area
Home Values in the Area
Average Home Value in this Area
Purchase History
| Date | Buyer | Sale Price | Title Company |
|---|---|---|---|
| Sfr Jv 1 2020 1 Borrower Llc | -- | None Available | |
| Sfr Jv 1 Property Llc | $172,500 | None Available | |
| Jones Rodney A | $125,000 | None Available | |
| Wise Living Precepts Llc | $95,000 | -- | |
| Household Realty Corp | $71,000 | -- | |
| Howell William E | $96,000 | -- |
Source: Public Records
Mortgage History
| Date | Status | Borrower | Loan Amount |
|---|---|---|---|
| Open | Sfr Jv 1 2020 1 Borrower Llc | $601,428 | |
| Previous Owner | Jones Rodney A | $128,700 |
Source: Public Records
Tax History
| Year | Tax Paid | Tax Assessment Tax Assessment Total Assessment is a certain percentage of the fair market value that is determined by local assessors to be the total taxable value of land and additions on the property. | Land | Improvement |
|---|---|---|---|---|
| 2025 | $1,836 | $289,120 | $85,000 | $204,120 |
| 2024 | $1,331 | $164,310 | $44,000 | $120,310 |
| 2023 | $1,290 | $164,310 | $44,000 | $120,310 |
| 2022 | $1,331 | $164,310 | $44,000 | $120,310 |
| 2021 | $1,331 | $164,310 | $44,000 | $120,310 |
| 2020 | $1,380 | $164,310 | $44,000 | $120,310 |
| 2019 | $1,336 | $162,910 | $44,000 | $118,910 |
| 2018 | $931 | $110,870 | $27,500 | $83,370 |
| 2017 | $931 | $110,870 | $27,500 | $83,370 |
| 2016 | $931 | $110,870 | $27,500 | $83,370 |
| 2015 | $945 | $110,870 | $27,500 | $83,370 |
| 2014 | $945 | $110,870 | $27,500 | $83,370 |
Source: Public Records
Map
Nearby Homes
- 101 White Water Ct
- 108 Eddy Ct
- 125 Bay Meadow Ln
- 1190 Sanders Rd
- 118 Willard Wood Run
- 32 Hot Springs Way
- 93 Hot Springs Way
- 59 Mineral Springs Way
- 358 Coats Ridge Dr
- 381 Gray Ghost St
- 182 Pleasant Ridge Ct
- 42 Saltwater Cove
- 16 Saddle Ridge Dr
- 86 Troy Dr
- 154 Winter Red Way
- 26 Valleydale Dr
- 387 N Pleasant Coates Rd
- 211 Mary Sandra Place
- 60 Applecross Dr
- 117 Primrose Ln
- 108 Rope Swing Cir
- 167 Creekstone Dr
- 104 Beaver Ridge Way
- 103 Rope Swing Cir
- 104 Rope Swing Cir
- 156 Beaver Ridge Way
- 163 Creekstone Dr
- 604 E Branch St
- LOT 77 Lazy Branch Dr
- 100 Rope Swing Cir
- 109 White Falls Cir
- 157 Creekstone Dr
- 172 Creekstone Dr
- 105 White Falls Cir
- 164 Creekstone Dr
- 168 Creekstone Dr
- 105 Beaver Ridge Way
- 90 White Water Ct
- 100 White Water Ct
- 101 Beaver Ridge Way
Your Personal Tour Guide
Ask me questions while you tour the home.