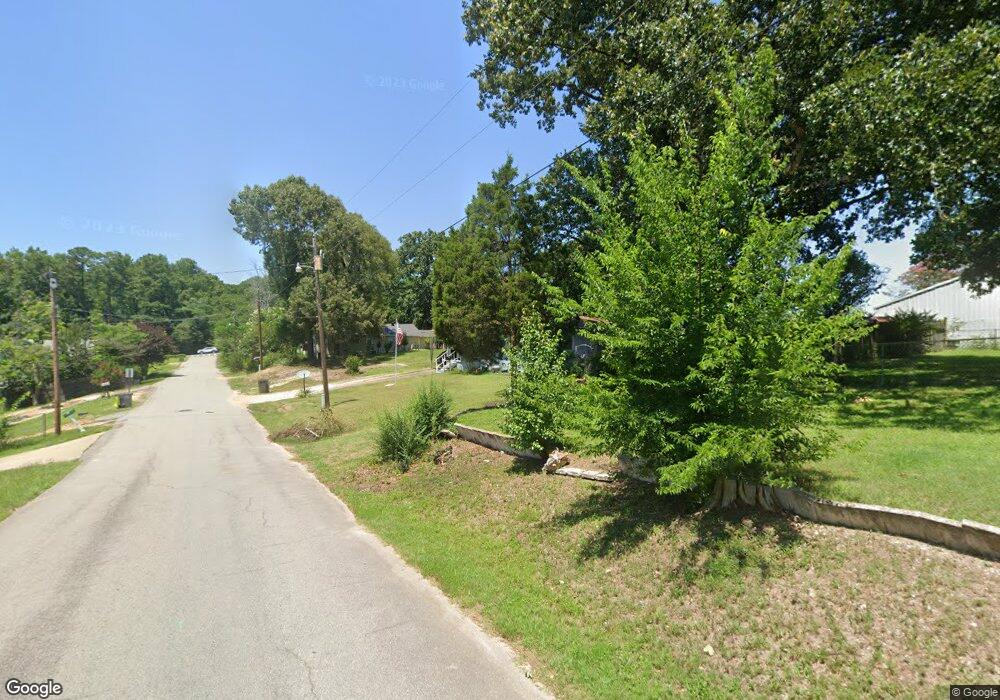
109 S 3rd St Benton, AR 72015
Estimated Value: $91,000 - $132,000
Studio
1
Bath
1,008
Sq Ft
$111/Sq Ft
Est. Value
About This Home
This home is located at 109 S 3rd St, Benton, AR 72015 and is currently estimated at $112,115, approximately $111 per square foot. 109 S 3rd St is a home located in Saline County with nearby schools including Angie Grant Elementary School, Benton Middle School, and Benton Junior High School.
Ownership History
Date
Name
Owned For
Owner Type
Purchase Details
Closed on
Sep 17, 2021
Sold by
Shelman Larry and Shelman Ronda
Bought by
Jones Andrew R
Current Estimated Value
Home Financials for this Owner
Home Financials are based on the most recent Mortgage that was taken out on this home.
Original Mortgage
$58,320
Outstanding Balance
$53,067
Interest Rate
2.8%
Mortgage Type
New Conventional
Estimated Equity
$59,048
Purchase Details
Closed on
Aug 8, 2019
Sold by
Shelman Bradley D and Shelman Chelsea
Bought by
Shelman Larry and Shelman Rhonda
Purchase Details
Closed on
Jan 28, 2008
Sold by
Graham Helen Louise and Thomas Jasper
Bought by
Shelman Bradley D
Home Financials for this Owner
Home Financials are based on the most recent Mortgage that was taken out on this home.
Original Mortgage
$69,410
Interest Rate
6.15%
Mortgage Type
FHA
Purchase Details
Closed on
Sep 8, 1999
Bought by
Graham
Purchase Details
Closed on
Sep 1, 1991
Bought by
Webb P
Create a Home Valuation Report for This Property
The Home Valuation Report is an in-depth analysis detailing your home's value as well as a comparison with similar homes in the area
Home Values in the Area
Average Home Value in this Area
Purchase History
| Date | Buyer | Sale Price | Title Company |
|---|---|---|---|
| Jones Andrew R | $72,900 | First National Title | |
| Shelman Larry | -- | None Available | |
| Shelman Bradley D | $71,000 | None Available | |
| Graham | $44,000 | -- | |
| Webb P | $29,000 | -- |
Source: Public Records
Mortgage History
| Date | Status | Borrower | Loan Amount |
|---|---|---|---|
| Open | Jones Andrew R | $58,320 | |
| Previous Owner | Shelman Bradley D | $69,410 |
Source: Public Records
Tax History
| Year | Tax Paid | Tax Assessment Tax Assessment Total Assessment is a certain percentage of the fair market value that is determined by local assessors to be the total taxable value of land and additions on the property. | Land | Improvement |
|---|---|---|---|---|
| 2025 | $1,010 | $18,235 | $3,600 | $14,635 |
| 2024 | $1,034 | $18,235 | $3,600 | $14,635 |
| 2023 | $1,010 | $18,235 | $3,600 | $14,635 |
| 2022 | $1,010 | $18,235 | $3,600 | $14,635 |
| 2021 | $850 | $15,350 | $3,000 | $12,350 |
| 2020 | $850 | $15,350 | $3,000 | $12,350 |
| 2019 | $850 | $15,350 | $3,000 | $12,350 |
| 2018 | $827 | $15,350 | $3,000 | $12,350 |
| 2017 | $758 | $15,350 | $3,000 | $12,350 |
| 2016 | $706 | $12,460 | $2,000 | $10,460 |
| 2015 | $699 | $12,460 | $2,000 | $10,460 |
| 2014 | $699 | $12,460 | $2,000 | $10,460 |
Source: Public Records
Map
Nearby Homes
Your Personal Tour Guide
Ask me questions while you tour the home.