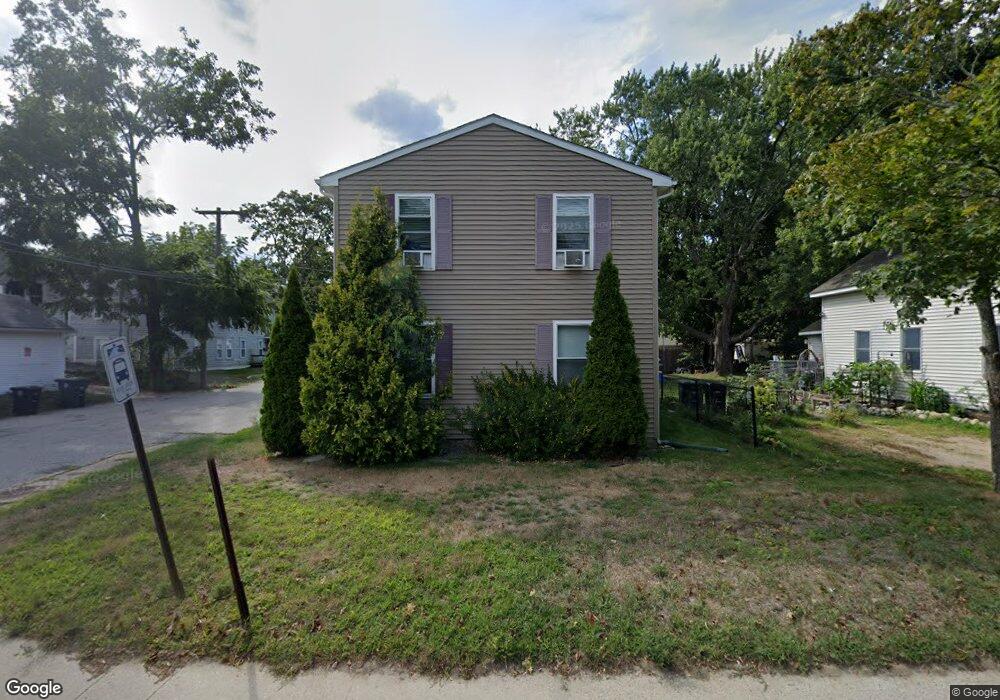
109 S Main St Coventry, RI 02816
Estimated Value: $331,663 - $421,000
4
Beds
2
Baths
1,392
Sq Ft
$280/Sq Ft
Est. Value
About This Home
This home is located at 109 S Main St, Coventry, RI 02816 and is currently estimated at $389,916, approximately $280 per square foot. 109 S Main St is a home located in Kent County with nearby schools including Alan Shawn Feinstein Ms Of Cov, Coventry High School, and Father John V. Doyle School.
Ownership History
Date
Name
Owned For
Owner Type
Purchase Details
Closed on
Oct 1, 2007
Sold by
Oneill Steven P and Oneill Patricia L
Bought by
Coventry Housing Assoc
Current Estimated Value
Home Financials for this Owner
Home Financials are based on the most recent Mortgage that was taken out on this home.
Original Mortgage
$137,700
Outstanding Balance
$85,930
Interest Rate
6.65%
Mortgage Type
Purchase Money Mortgage
Estimated Equity
$303,986
Create a Home Valuation Report for This Property
The Home Valuation Report is an in-depth analysis detailing your home's value as well as a comparison with similar homes in the area
Purchase History
| Date | Buyer | Sale Price | Title Company |
|---|---|---|---|
| Coventry Housing Assoc | $159,120 | -- |
Source: Public Records
Mortgage History
| Date | Status | Borrower | Loan Amount |
|---|---|---|---|
| Open | Coventry Housing Assoc | $137,700 | |
| Previous Owner | Coventry Housing Assoc | $99,750 | |
| Previous Owner | Coventry Housing Assoc | $92,000 |
Source: Public Records
Tax History
| Year | Tax Paid | Tax Assessment Tax Assessment Total Assessment is a certain percentage of the fair market value that is determined by local assessors to be the total taxable value of land and additions on the property. | Land | Improvement |
|---|---|---|---|---|
| 2025 | $3,649 | $226,800 | $51,000 | $175,800 |
| 2024 | $3,594 | $226,900 | $51,000 | $175,900 |
| 2023 | $3,478 | $226,900 | $51,000 | $175,900 |
| 2022 | $3,300 | $168,600 | $47,400 | $121,200 |
| 2021 | $3,271 | $168,600 | $47,400 | $121,200 |
| 2020 | $3,750 | $168,600 | $47,400 | $121,200 |
| 2019 | $2,373 | $106,700 | $23,500 | $83,200 |
| 2018 | $2,306 | $106,700 | $23,500 | $83,200 |
| 2017 | $2,239 | $106,700 | $23,500 | $83,200 |
| 2016 | $2,473 | $115,500 | $19,100 | $96,400 |
| 2015 | $2,406 | $115,500 | $19,100 | $96,400 |
| 2014 | $2,356 | $115,500 | $19,100 | $96,400 |
| 2013 | $2,319 | $124,300 | $30,900 | $93,400 |
Source: Public Records
Map
Nearby Homes
Your Personal Tour Guide
Ask me questions while you tour the home.