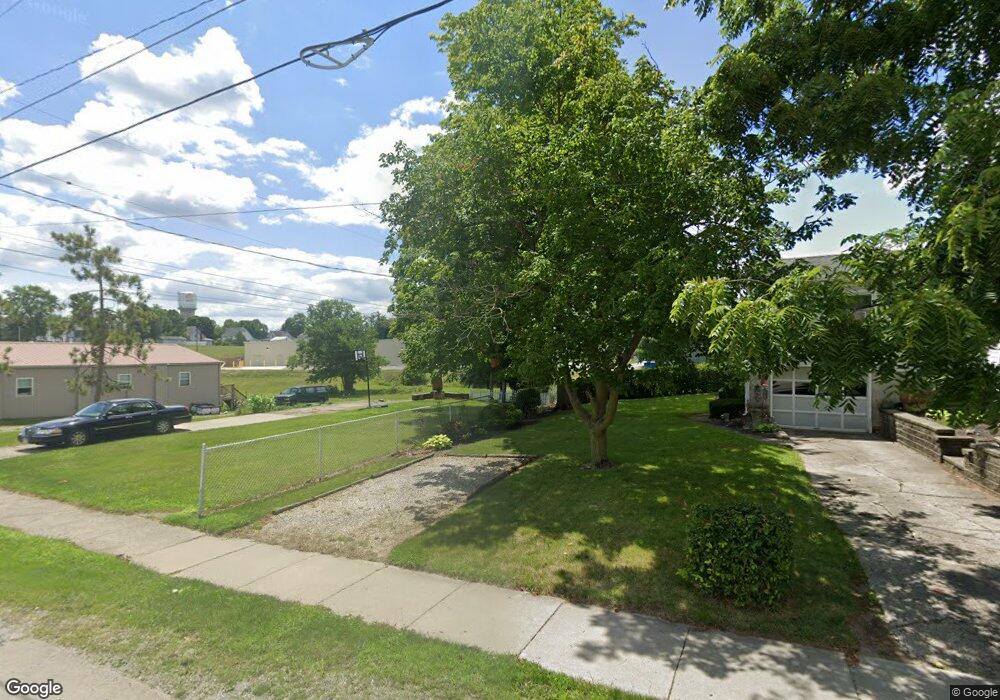
109 S Taylor West Unity, OH 43570
Estimated Value: $150,000 - $179,000
4
Beds
2
Baths
2,012
Sq Ft
$85/Sq Ft
Est. Value
About This Home
This home is located at 109 S Taylor, West Unity, OH 43570 and is currently estimated at $170,495, approximately $84 per square foot. 109 S Taylor is a home located in Williams County with nearby schools including Hilltop Elementary School and Hilltop High School.
Ownership History
Date
Name
Owned For
Owner Type
Purchase Details
Closed on
Oct 11, 2023
Sold by
Bell James B and Bell Kristy L
Bought by
Burdine Randy L
Current Estimated Value
Home Financials for this Owner
Home Financials are based on the most recent Mortgage that was taken out on this home.
Original Mortgage
$150,000
Outstanding Balance
$144,609
Interest Rate
4%
Mortgage Type
VA
Estimated Equity
$25,886
Purchase Details
Closed on
Dec 30, 2003
Sold by
Klopfenstein Deborah A
Bought by
Bell James B and Bell Kristy L
Purchase Details
Closed on
Aug 10, 2000
Sold by
Klopfenstein Robert V and Klopfenstein Deborah A
Bought by
Klopfenstein Deborah A
Purchase Details
Closed on
Jun 18, 1997
Sold by
Schrock Weston W
Bought by
Klopfenstein Robert and Klopfenstein Deborah A
Purchase Details
Closed on
Jan 1, 1990
Bought by
Schrock Weston W
Create a Home Valuation Report for This Property
The Home Valuation Report is an in-depth analysis detailing your home's value as well as a comparison with similar homes in the area
Home Values in the Area
Average Home Value in this Area
Purchase History
| Date | Buyer | Sale Price | Title Company |
|---|---|---|---|
| Burdine Randy L | $125 | None Listed On Document | |
| Burdine Randy L | $125 | None Listed On Document | |
| Bell James B | $107,000 | -- | |
| Klopfenstein Deborah A | -- | -- | |
| Klopfenstein Robert | $89,000 | -- | |
| Schrock Weston W | -- | -- |
Source: Public Records
Mortgage History
| Date | Status | Borrower | Loan Amount |
|---|---|---|---|
| Open | Burdine Randy L | $150,000 | |
| Closed | Burdine Randy L | $150,000 |
Source: Public Records
Tax History Compared to Growth
Tax History
| Year | Tax Paid | Tax Assessment Tax Assessment Total Assessment is a certain percentage of the fair market value that is determined by local assessors to be the total taxable value of land and additions on the property. | Land | Improvement |
|---|---|---|---|---|
| 2024 | $1,966 | $49,140 | $5,180 | $43,960 |
| 2023 | $1,966 | $36,650 | $5,250 | $31,400 |
| 2022 | $1,745 | $36,650 | $5,250 | $31,400 |
| 2021 | $1,745 | $36,650 | $5,250 | $31,400 |
| 2020 | $1,546 | $31,330 | $4,480 | $26,850 |
| 2019 | $1,522 | $31,330 | $4,480 | $26,850 |
| 2018 | $1,496 | $31,330 | $4,480 | $26,850 |
| 2017 | $1,524 | $31,120 | $4,270 | $26,850 |
| 2016 | $1,454 | $31,120 | $4,270 | $26,850 |
| 2015 | $1,658 | $31,120 | $4,270 | $26,850 |
| 2014 | $1,658 | $32,730 | $4,480 | $28,250 |
| 2013 | $1,640 | $32,730 | $4,480 | $28,250 |
Source: Public Records
Map
Nearby Homes
- 205 Taylor Dr
- 311 W Rings St
- 000 W Jackson
- 340 S Main St
- 22227 Us Highway 20a
- 16806 US Highway 20a
- 15664 County Road K
- 18 Cobblestone Rd
- 16228 County Road N-30
- 0 U S 20
- 305 W Mulberry St
- 0 St Rt 15 Unit 10001011
- 10628 Ohio 15
- 301 Horton St
- 3063 County Road 26-2
- 22018 County Road F
- 5065 County Road 20-50
- 0 County Road F
- 23161 County Road Jk
- 7170 County Road 23