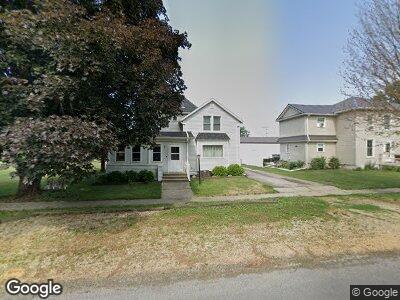
109 S Walnut St Franklin Grove, IL 61031
Franklin Grove-Nachusa NeighborhoodEstimated Value: $125,000 - $189,000
--
Bed
2
Baths
1,452
Sq Ft
$111/Sq Ft
Est. Value
About This Home
This home is located at 109 S Walnut St, Franklin Grove, IL 61031 and is currently estimated at $161,430, approximately $111 per square foot. 109 S Walnut St is a home located in Lee County with nearby schools including Ashton-Franklin Center Elementary School, Ashton-Franklin Center Middle School, and Ashton-Franklin Center High School.
Ownership History
Date
Name
Owned For
Owner Type
Purchase Details
Closed on
Mar 1, 2021
Sold by
Pineda Daniel A and Pineda Jennifer L
Bought by
Bolt Savanna P
Current Estimated Value
Home Financials for this Owner
Home Financials are based on the most recent Mortgage that was taken out on this home.
Original Mortgage
$132,828
Outstanding Balance
$119,880
Interest Rate
2.7%
Mortgage Type
New Conventional
Estimated Equity
$23,494
Purchase Details
Closed on
May 17, 2016
Sold by
Bass Robert M and Bass Kristina L
Bought by
Pineda Daniel A and Pineda Jennifer L
Home Financials for this Owner
Home Financials are based on the most recent Mortgage that was taken out on this home.
Original Mortgage
$114,918
Interest Rate
3.59%
Mortgage Type
VA
Purchase Details
Closed on
Mar 26, 2010
Sold by
Bass Kristina L and Burgett Kristina L
Bought by
Bass Robert M and Bass Kristina L
Purchase Details
Closed on
Sep 30, 2002
Bought by
Bass Robert M and Bass Kristina L
Create a Home Valuation Report for This Property
The Home Valuation Report is an in-depth analysis detailing your home's value as well as a comparison with similar homes in the area
Home Values in the Area
Average Home Value in this Area
Purchase History
| Date | Buyer | Sale Price | Title Company |
|---|---|---|---|
| Bolt Savanna P | $131,500 | None Available | |
| Pineda Daniel A | $56,253 | -- | |
| Bass Robert M | -- | None Available | |
| Bass Robert M | $59,000 | -- |
Source: Public Records
Mortgage History
| Date | Status | Borrower | Loan Amount |
|---|---|---|---|
| Open | Bolt Savanna P | $132,828 | |
| Closed | Bolt Savanna P | $132,828 | |
| Previous Owner | Pineda Daniel A | $107,046 | |
| Previous Owner | Pineda Daniel A | $114,918 | |
| Previous Owner | Bass Robert M | $74,750 | |
| Previous Owner | Bass Robert M | $25,000 | |
| Previous Owner | Burgett Kristina L | $17,000 |
Source: Public Records
Tax History Compared to Growth
Tax History
| Year | Tax Paid | Tax Assessment Tax Assessment Total Assessment is a certain percentage of the fair market value that is determined by local assessors to be the total taxable value of land and additions on the property. | Land | Improvement |
|---|---|---|---|---|
| 2024 | $2,568 | $37,521 | $3,857 | $33,664 |
| 2023 | $2,225 | $32,627 | $3,354 | $29,273 |
| 2022 | $2,058 | $29,933 | $3,077 | $26,856 |
| 2021 | $2,172 | $31,098 | $2,944 | $28,154 |
| 2020 | $1,902 | $30,192 | $2,858 | $27,334 |
| 2019 | $2,086 | $29,313 | $2,775 | $26,538 |
| 2018 | $1,916 | $27,917 | $2,643 | $25,274 |
| 2017 | $1,645 | $24,785 | $2,643 | $22,142 |
| 2016 | $1,653 | $24,785 | $2,643 | $22,142 |
| 2015 | $1,177 | $24,785 | $2,643 | $22,142 |
| 2014 | $1,180 | $24,785 | $2,643 | $22,142 |
| 2013 | $1,434 | $28,582 | $3,242 | $25,340 |
Source: Public Records
Map
Nearby Homes
- 124 W Middle St
- 215 W Hughes St
- 247 W Maple St
- 326 Old Mill Rd
- Lot 4 Daysville Rd
- 1479 Old Mill Rd
- 1841 Robbins Rd
- 8554 S Daysville Rd
- 511 Richardson Ave
- 908 Main St
- 808 Evans Ave
- 1003 Cartwright Ave
- 1735 Nachusa Rd
- 110 Flambeau Ln
- 203 Flambeau Ln
- 214 Park Dr
- 103 Wolf Dr
- 107 Maple Ln
- 217 Park Dr
- 105 Oak Ln