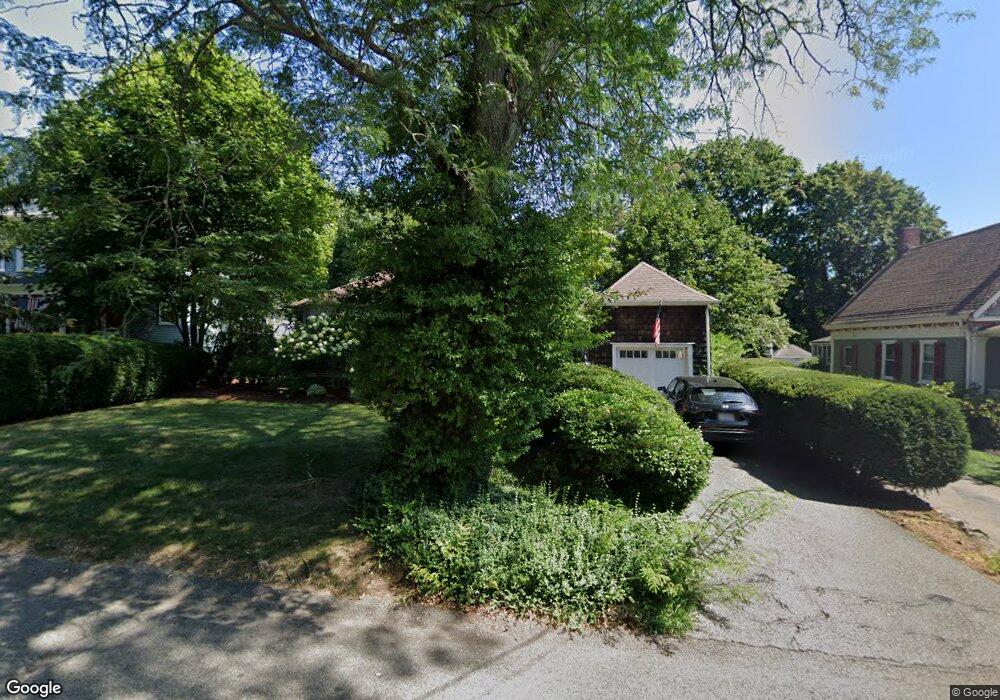
109 School St Braintree, MA 02184
East Braintree NeighborhoodEstimated Value: $602,000 - $620,883
1
Bed
1
Bath
1,138
Sq Ft
$538/Sq Ft
Est. Value
About This Home
This home is located at 109 School St, Braintree, MA 02184 and is currently estimated at $612,721, approximately $538 per square foot. 109 School St is a home located in Norfolk County with nearby schools including Braintree High School, Meeting House Montessori School, and South Shore SDA School.
Ownership History
Date
Name
Owned For
Owner Type
Purchase Details
Closed on
Jun 12, 2019
Sold by
Elsmore Suzanne
Bought by
Suzanne Elsmore Ret
Current Estimated Value
Purchase Details
Closed on
Dec 30, 2016
Sold by
Suzanne Elsmore Ret
Bought by
Elsmore Suzanne
Purchase Details
Closed on
Apr 2, 2015
Sold by
Elsmore Suzanne
Bought by
Suzanne Elsmore Ret
Purchase Details
Closed on
Jul 30, 1993
Sold by
Hyslop Raymond T
Bought by
Elsmore Suzanne
Create a Home Valuation Report for This Property
The Home Valuation Report is an in-depth analysis detailing your home's value as well as a comparison with similar homes in the area
Home Values in the Area
Average Home Value in this Area
Purchase History
| Date | Buyer | Sale Price | Title Company |
|---|---|---|---|
| Suzanne Elsmore Ret | -- | -- | |
| Elsmore Suzanne | -- | -- | |
| Suzanne Elsmore Ret | -- | -- | |
| Elsmore Suzanne | $122,000 | -- | |
| Elsmore Suzanne | $122,000 | -- |
Source: Public Records
Mortgage History
| Date | Status | Borrower | Loan Amount |
|---|---|---|---|
| Previous Owner | Elsmore Suzanne | $120,000 | |
| Previous Owner | Elsmore Suzanne | $83,000 | |
| Previous Owner | Elsmore Suzanne | $25,000 |
Source: Public Records
Tax History Compared to Growth
Tax History
| Year | Tax Paid | Tax Assessment Tax Assessment Total Assessment is a certain percentage of the fair market value that is determined by local assessors to be the total taxable value of land and additions on the property. | Land | Improvement |
|---|---|---|---|---|
| 2025 | $5,679 | $569,000 | $374,000 | $195,000 |
| 2024 | $5,145 | $542,700 | $350,600 | $192,100 |
| 2023 | $4,864 | $498,400 | $317,900 | $180,500 |
| 2022 | $4,587 | $461,000 | $280,500 | $180,500 |
| 2021 | $4,473 | $449,500 | $280,500 | $169,000 |
| 2020 | $4,100 | $415,800 | $246,800 | $169,000 |
| 2019 | $4,015 | $397,900 | $246,800 | $151,100 |
| 2018 | $3,700 | $351,000 | $205,700 | $145,300 |
| 2017 | $3,770 | $351,000 | $205,700 | $145,300 |
| 2016 | $3,609 | $328,700 | $187,000 | $141,700 |
| 2015 | $3,608 | $325,900 | $184,200 | $141,700 |
| 2014 | $3,319 | $290,600 | $167,400 | $123,200 |
Source: Public Records
Map
Nearby Homes
- 106 Home Park Rd
- 9 Independence Ave Unit 307
- 48 Conrad St
- 29 Joseph Rd
- 491 Washington St Unit 1
- 192 Federal Ave Unit B
- 37 Monatiquot Ave
- 1 Pantano St
- 86 Alton Rd
- 6 Oak St
- 347 Centre St
- 177 Franklin St
- 21 Totman St Unit 202
- 21 Totman St Unit 309
- 21 Totman St Unit Model-1
- 21 Totman St Unit 209
- 21 Totman St Unit 203
- 21 Totman St Unit 2
- 74 Magnolia St
- 166 Phipps St