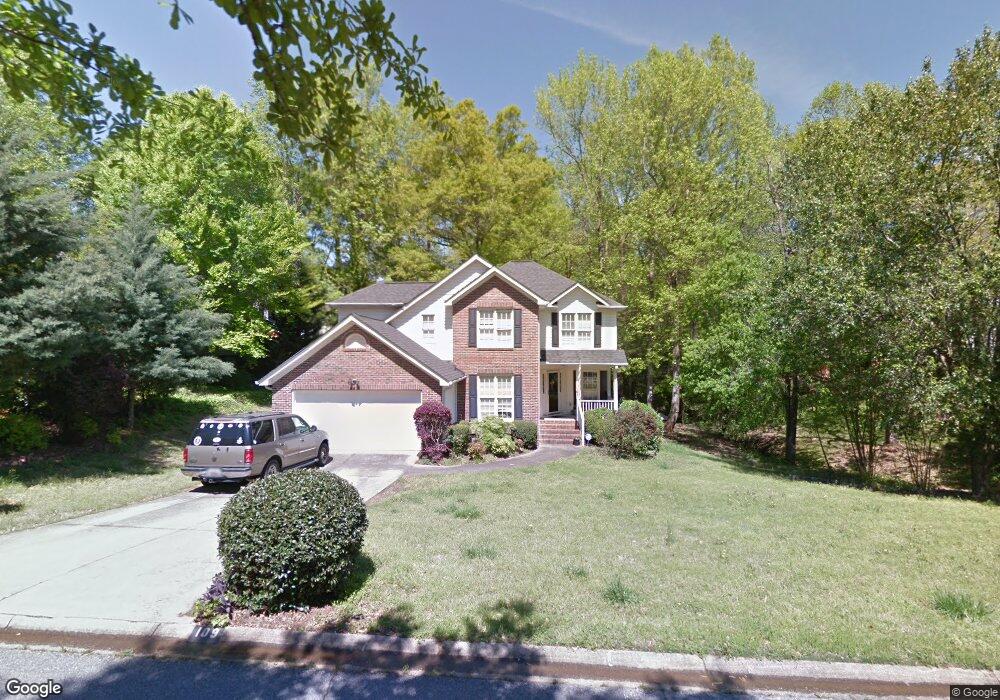
109 Sea Oats Inlet Mauldin, SC 29662
Estimated Value: $314,000 - $350,476
4
Beds
3
Baths
1,850
Sq Ft
$182/Sq Ft
Est. Value
About This Home
This home is located at 109 Sea Oats Inlet, Mauldin, SC 29662 and is currently estimated at $336,369, approximately $181 per square foot. 109 Sea Oats Inlet is a home located in Greenville County with nearby schools including Greenbrier Elementary School, Hillcrest Middle School, and Mauldin High School.
Ownership History
Date
Name
Owned For
Owner Type
Purchase Details
Closed on
Jul 30, 2010
Sold by
Hicks W Todd
Bought by
Sink Heather G and Johnson Brian T
Current Estimated Value
Home Financials for this Owner
Home Financials are based on the most recent Mortgage that was taken out on this home.
Original Mortgage
$155,900
Outstanding Balance
$104,771
Interest Rate
4.87%
Mortgage Type
FHA
Estimated Equity
$231,598
Purchase Details
Closed on
Dec 15, 2004
Sold by
Hicks Regina T
Bought by
Hicks W Todd
Purchase Details
Closed on
Jun 23, 2004
Sold by
Wilshaw Development Llc
Bought by
Hicks Regina T
Purchase Details
Closed on
May 10, 2004
Sold by
Wilshaw Development Llc
Bought by
Hicks Regina T
Purchase Details
Closed on
May 4, 2004
Sold by
Wilshaw Development Llc
Bought by
Hicks Regina T
Purchase Details
Closed on
Nov 6, 2003
Sold by
Hopkins Clyde H
Bought by
Wells Fargo
Create a Home Valuation Report for This Property
The Home Valuation Report is an in-depth analysis detailing your home's value as well as a comparison with similar homes in the area
Home Values in the Area
Average Home Value in this Area
Purchase History
| Date | Buyer | Sale Price | Title Company |
|---|---|---|---|
| Sink Heather G | $158,000 | -- | |
| Hicks W Todd | -- | -- | |
| Hicks Regina T | $149,000 | -- | |
| Hicks Regina T | $125,000 | -- | |
| Hicks Regina T | $125,000 | -- | |
| Wells Fargo | $2,500 | -- |
Source: Public Records
Mortgage History
| Date | Status | Borrower | Loan Amount |
|---|---|---|---|
| Open | Sink Heather G | $155,900 |
Source: Public Records
Tax History Compared to Growth
Tax History
| Year | Tax Paid | Tax Assessment Tax Assessment Total Assessment is a certain percentage of the fair market value that is determined by local assessors to be the total taxable value of land and additions on the property. | Land | Improvement |
|---|---|---|---|---|
| 2024 | $1,307 | $7,170 | $1,240 | $5,930 |
| 2023 | $1,307 | $7,170 | $1,240 | $5,930 |
| 2022 | $1,231 | $7,170 | $1,240 | $5,930 |
| 2021 | $1,232 | $7,170 | $1,240 | $5,930 |
| 2020 | $1,137 | $6,240 | $1,080 | $5,160 |
| 2019 | $1,137 | $6,240 | $1,080 | $5,160 |
| 2018 | $1,135 | $6,240 | $1,080 | $5,160 |
| 2017 | $1,135 | $6,240 | $1,080 | $5,160 |
| 2016 | $1,091 | $155,910 | $27,000 | $128,910 |
| 2015 | $1,091 | $155,910 | $27,000 | $128,910 |
| 2014 | $1,185 | $170,700 | $30,000 | $140,700 |
Source: Public Records
Map
Nearby Homes
- 4 Natchez Dr
- 111 Golden Crest Ct
- 24 Poplar Springs Dr
- 310 Ashmore Bridge Rd
- 211 Bellport Dr
- 712 Brooks Rd
- 220 Horse Tack Trail
- 234 Paperbark Dr
- 238 Paperbark Dr
- 240 Paperbark Dr
- 242 Paperbark Dr
- 244 Paperbark Dr
- 237 Paperbark Dr
- 239 Paperbark Dr
- 202 Greenport Way
- 241 Paperbark Dr
- 243 Paperbark Dr
- 245 Paperbark Dr
- 105 Sea Oats Inlet
- 416 Planters Row Dr
- 23 Marsh Creek Dr
- 412 Planters Row Dr
- 108 Sea Oats Inlet
- 106 Sea Oats Inlet
- 21 Marsh Creek Dr
- 25 Marsh Creek Dr
- 110 Sea Oats Inlet
- 104 Sea Oats Inlet
- 408 Planters Row Dr
- 19 Marsh Creek Dr
- 1 Seagrass Ct
- 102 Sea Oats Inlet
- 404 Planters Row Dr
- 17 Marsh Creek Dr
- 405 Planters Row Dr
- 19 Sea Oats Inlet
- 3 Seagrass Ct
- 2 Seagrass Ct