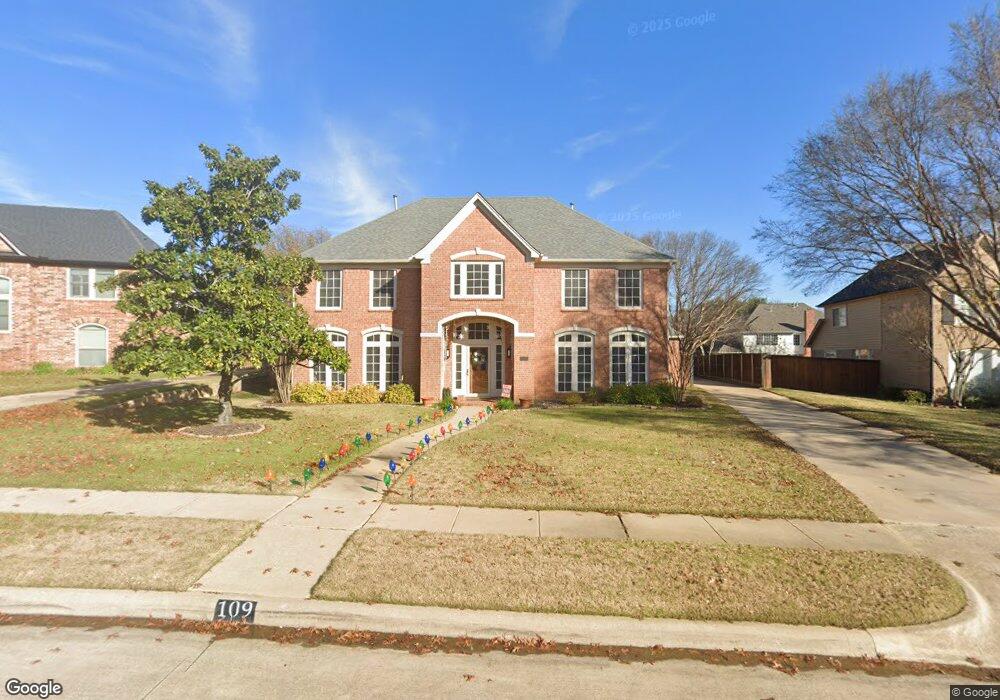
109 Starling Ct Southlake, TX 76092
Estimated Value: $864,000 - $1,025,483
4
Beds
4
Baths
3,669
Sq Ft
$260/Sq Ft
Est. Value
About This Home
This home is located at 109 Starling Ct, Southlake, TX 76092 and is currently estimated at $955,621, approximately $260 per square foot. 109 Starling Ct is a home located in Tarrant County with nearby schools including Carroll Elementary School, Don T. Durham Intermediate School, and Carroll Middle School.
Ownership History
Date
Name
Owned For
Owner Type
Purchase Details
Closed on
Feb 10, 2025
Sold by
Doyle Shawn Caspar and Doyle Julie Thomas
Bought by
Shawn And Julie Doyle Family Trust and Doyle
Current Estimated Value
Purchase Details
Closed on
Aug 15, 1997
Sold by
First American Bank Texas Ssb
Bought by
Doyle Shawn C and Doyle Julie Thomas
Home Financials for this Owner
Home Financials are based on the most recent Mortgage that was taken out on this home.
Original Mortgage
$194,000
Interest Rate
7.47%
Mortgage Type
Balloon
Purchase Details
Closed on
May 6, 1997
Sold by
Lydick Andy
Bought by
First American Bank Ssb
Purchase Details
Closed on
Nov 30, 1994
Sold by
Perry Homes
Bought by
Miller Ii Daren L and Miller Shirley J
Home Financials for this Owner
Home Financials are based on the most recent Mortgage that was taken out on this home.
Original Mortgage
$247,000
Interest Rate
6.12%
Create a Home Valuation Report for This Property
The Home Valuation Report is an in-depth analysis detailing your home's value as well as a comparison with similar homes in the area
Home Values in the Area
Average Home Value in this Area
Purchase History
| Date | Buyer | Sale Price | Title Company |
|---|---|---|---|
| Shawn And Julie Doyle Family Trust | -- | None Listed On Document | |
| Doyle Shawn C | -- | Commonwealth Land Title | |
| First American Bank Ssb | $223,850 | -- | |
| Miller Ii Daren L | -- | Stewart Title |
Source: Public Records
Mortgage History
| Date | Status | Borrower | Loan Amount |
|---|---|---|---|
| Previous Owner | Doyle Shawn C | $194,000 | |
| Previous Owner | Miller Ii Daren L | $247,000 |
Source: Public Records
Tax History Compared to Growth
Tax History
| Year | Tax Paid | Tax Assessment Tax Assessment Total Assessment is a certain percentage of the fair market value that is determined by local assessors to be the total taxable value of land and additions on the property. | Land | Improvement |
|---|---|---|---|---|
| 2025 | $9,782 | $811,236 | $249,600 | $561,636 |
| 2024 | $9,782 | $824,253 | $249,600 | $574,653 |
| 2023 | $11,037 | $725,000 | $249,600 | $475,400 |
| 2022 | $11,876 | $550,500 | $166,400 | $384,100 |
| 2021 | $12,551 | $550,500 | $166,400 | $384,100 |
| 2020 | $12,654 | $550,500 | $147,269 | $403,231 |
| 2019 | $13,190 | $544,687 | $120,000 | $424,687 |
| 2018 | $11,613 | $512,770 | $120,000 | $392,770 |
| 2017 | $12,281 | $507,937 | $100,000 | $407,937 |
| 2016 | $11,165 | $474,707 | $100,000 | $374,707 |
| 2015 | $9,852 | $409,500 | $55,000 | $354,500 |
| 2014 | $9,852 | $409,500 | $55,000 | $354,500 |
Source: Public Records
Map
Nearby Homes
- 1712 Wild Rose Way
- 2530 & 2580 W Southlake Blvd
- 207 Killdeer Trail
- 203 Donley Ct
- 205 Lovegrass Ln
- 2116 Camden Cir
- 503 Indian Paintbrush Way
- 1807 Mesquite Ct
- 1811 Redwing Ct
- 204 Southridge Lakes Pkwy
- 2304 Top Rail Ln
- 550 N Peytonville Ave
- 1340 Meadow Glen
- 203 Manor Place
- 275 Timberline Ln
- 904 Palos Verdes Trail
- 690 S Peytonville Ave
- 710 Deer Hollow Blvd
- 2009 Montecito Trail
- 404 Branding Iron Ct
- 107 Starling Ct
- 111 Starling Ct
- 110 Killdeer Ct
- 112 Killdeer Ct
- 108 Killdeer Ct
- 105 Starling Ct
- 108 Starling Ct
- 106 Starling Ct
- 114 Killdeer Ct
- 106 Killdeer Ct
- 1706 Wild Rose Way
- 103 Starling Ct
- 1704 Wild Rose Way
- 104 Starling Ct
- 1710 Wild Rose Way
- 104 Killdeer Ct
- 109 Killdeer Ct
- 111 Killdeer Ct
- 107 Killdeer Ct
- 107 Killdeer Ct