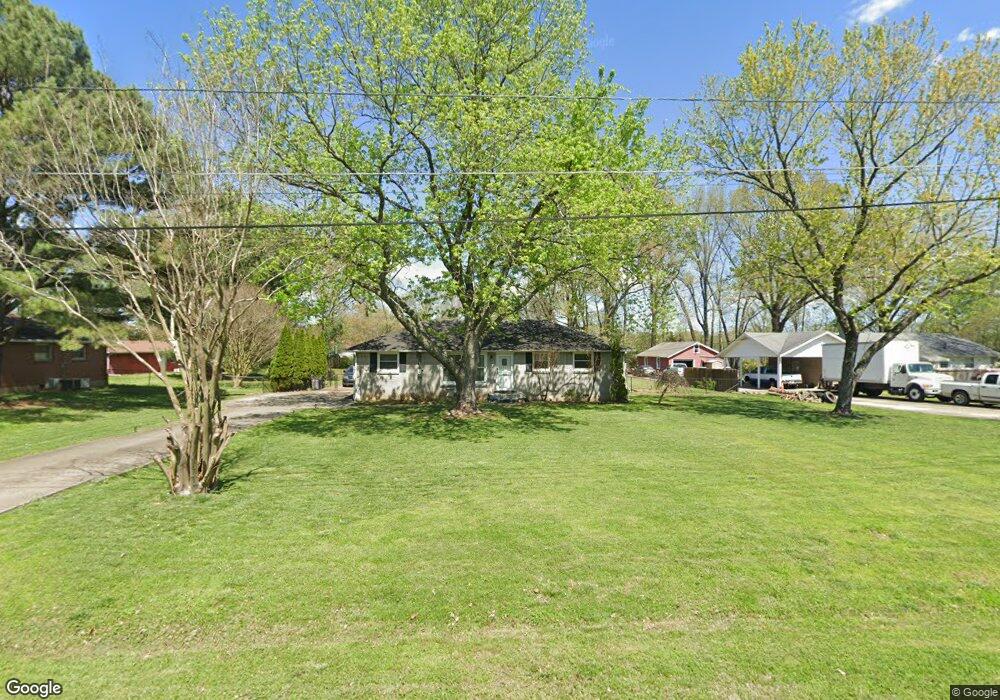
109 Stewarts View Dr Smyrna, TN 37167
Estimated Value: $266,828 - $295,000
--
Bed
1
Bath
1,275
Sq Ft
$217/Sq Ft
Est. Value
About This Home
This home is located at 109 Stewarts View Dr, Smyrna, TN 37167 and is currently estimated at $276,707, approximately $217 per square foot. 109 Stewarts View Dr is a home located in Rutherford County with nearby schools including Smyrna Primary School, Smyrna Middle School, and Smyrna High School.
Ownership History
Date
Name
Owned For
Owner Type
Purchase Details
Closed on
Aug 2, 2021
Sold by
Colon Daniel and Colon Ashley
Bought by
Massey Regina Erin Gabrielle and Massey Rozealia
Current Estimated Value
Home Financials for this Owner
Home Financials are based on the most recent Mortgage that was taken out on this home.
Original Mortgage
$228,956
Outstanding Balance
$208,502
Interest Rate
3%
Mortgage Type
FHA
Estimated Equity
$68,205
Purchase Details
Closed on
Jul 24, 2017
Sold by
Wilson Daniel B
Bought by
Colon Daniel and Colon Ashley
Home Financials for this Owner
Home Financials are based on the most recent Mortgage that was taken out on this home.
Original Mortgage
$14,319
Interest Rate
3.96%
Mortgage Type
FHA
Purchase Details
Closed on
Oct 2, 2009
Sold by
Wilson James K
Bought by
Wilson Daniel B
Home Financials for this Owner
Home Financials are based on the most recent Mortgage that was taken out on this home.
Original Mortgage
$82,478
Interest Rate
5.05%
Create a Home Valuation Report for This Property
The Home Valuation Report is an in-depth analysis detailing your home's value as well as a comparison with similar homes in the area
Home Values in the Area
Average Home Value in this Area
Purchase History
| Date | Buyer | Sale Price | Title Company |
|---|---|---|---|
| Massey Regina Erin Gabrielle | $233,181 | Southeast Ttl Of Murfreesbor | |
| Colon Daniel | $148,000 | Broker Title & Escrow Llc | |
| Wilson Daniel B | $84,000 | -- |
Source: Public Records
Mortgage History
| Date | Status | Borrower | Loan Amount |
|---|---|---|---|
| Open | Massey Regina Erin Gabrielle | $228,956 | |
| Previous Owner | Colon Daniel | $14,319 | |
| Previous Owner | Wilson Daniel B | $82,478 |
Source: Public Records
Tax History Compared to Growth
Tax History
| Year | Tax Paid | Tax Assessment Tax Assessment Total Assessment is a certain percentage of the fair market value that is determined by local assessors to be the total taxable value of land and additions on the property. | Land | Improvement |
|---|---|---|---|---|
| 2025 | -- | $52,488 | $13,750 | $38,738 |
| 2024 | $1,261 | $52,488 | $13,750 | $38,738 |
| 2023 | $1,261 | $52,488 | $13,750 | $38,738 |
| 2022 | $1,124 | $52,488 | $13,750 | $38,738 |
| 2021 | $979 | $33,538 | $8,750 | $24,788 |
| 2020 | $979 | $33,538 | $8,750 | $24,788 |
| 2019 | $979 | $33,538 | $8,750 | $24,788 |
| 2018 | $939 | $33,538 | $0 | $0 |
| 2017 | $931 | $26,125 | $0 | $0 |
| 2016 | $931 | $26,125 | $0 | $0 |
| 2015 | $931 | $26,125 | $0 | $0 |
| 2014 | $650 | $26,125 | $0 | $0 |
| 2013 | -- | $22,250 | $0 | $0 |
Source: Public Records
Map
Nearby Homes
- 205 Bane Dr
- 106 Halfrunner Way Unit 4
- 104 Halfrunner Way Unit 3
- 102 Halfrunner Way Unit 2
- 100 Halfrunner Way Unit 1
- 201 Bane Dr
- 203 McNickle Dr
- 116 Avondale Dr
- 108 McNickle Dr
- 640 Ken Pilkerton Dr
- 702 Mill Springs Dr
- 313 Mayfield Dr
- 202 Latimer Dr
- 307 Dartford Ct
- 104 Belaire Dr
- 401 Ravencliff Ct
- 203 S Lowry St
- 303 Davis Park Dr
- 1547 Repton Rd
- 104 Evanmeade Dr
- 107 Stewarts View Dr
- 111 Stewarts View Dr
- 105 Stewarts View Dr
- 460 S Lowry St
- 113 Stewarts View Dr
- 108 Stewarts View Dr
- 110 Stewarts View Dr
- 106 Stewarts View Dr
- 114 Stewarts View Dr
- 103 Stewarts View Dr
- 112 Stewarts View Dr
- 104 Stewarts View Dr
- 102 Stewarts View Dr
- 0 Joyner Dr
- 401 Belaire Dr
- 307 Belaire Dr
- 403 Belaire Dr
- 405 Belaire Dr
- 417 S Lowry St
- 305 Belaire Dr