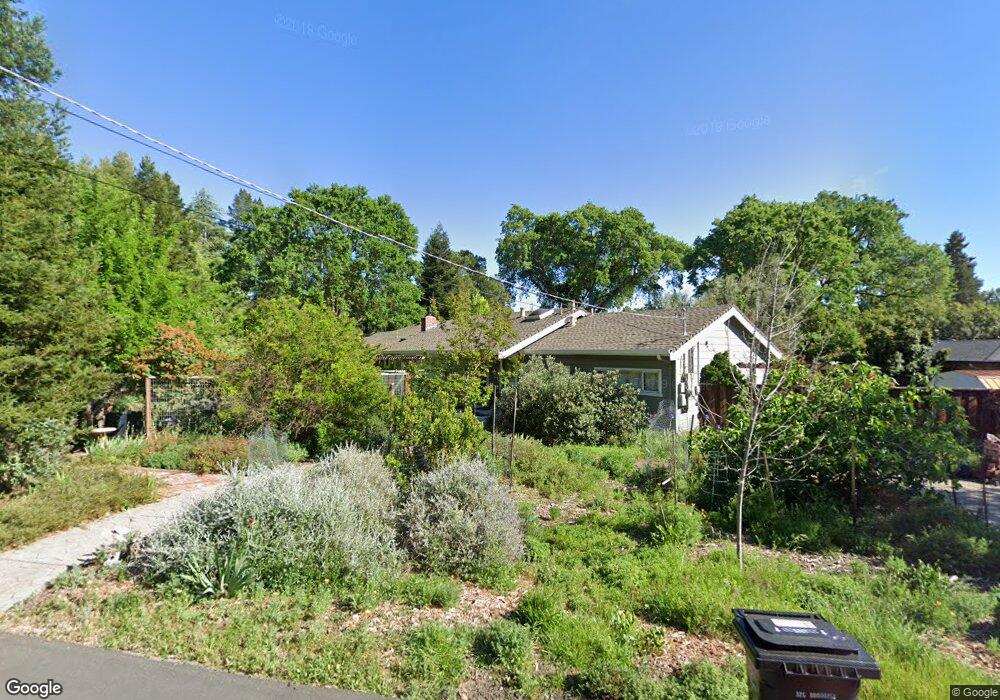
109 Sylvan Rd Walnut Creek, CA 94596
Walnut Heights NeighborhoodEstimated Value: $1,093,000 - $1,592,000
3
Beds
2
Baths
1,616
Sq Ft
$870/Sq Ft
Est. Value
About This Home
This home is located at 109 Sylvan Rd, Walnut Creek, CA 94596 and is currently estimated at $1,405,300, approximately $869 per square foot. 109 Sylvan Rd is a home located in Contra Costa County with nearby schools including Walnut Heights Elementary School, Walnut Creek Intermediate School, and Las Lomas High School.
Ownership History
Date
Name
Owned For
Owner Type
Purchase Details
Closed on
Oct 19, 2021
Sold by
Stone Peter D and Mason Susan A
Bought by
Stone Peter D and Mason Susan A
Current Estimated Value
Purchase Details
Closed on
Jun 9, 1998
Sold by
Foote Richard L and Michaels Laurin A
Bought by
Stone Peter D and Mason Susan A
Home Financials for this Owner
Home Financials are based on the most recent Mortgage that was taken out on this home.
Original Mortgage
$262,500
Interest Rate
6.9%
Mortgage Type
Purchase Money Mortgage
Purchase Details
Closed on
May 15, 1997
Sold by
Johnson Richard F and Johnson Joanne B
Bought by
Foote Richard L
Home Financials for this Owner
Home Financials are based on the most recent Mortgage that was taken out on this home.
Original Mortgage
$284,500
Interest Rate
8%
Mortgage Type
Purchase Money Mortgage
Create a Home Valuation Report for This Property
The Home Valuation Report is an in-depth analysis detailing your home's value as well as a comparison with similar homes in the area
Home Values in the Area
Average Home Value in this Area
Purchase History
We collect this data history from publicly available records. To have your information removed, we recommend requesting removal directly through your county’s website.
| Date | Buyer | Sale Price | Title Company |
|---|---|---|---|
| Stone Peter D | -- | None Available | |
| Stone Peter D | $350,000 | North American Title | |
| Foote Richard L | $299,500 | American Title Co |
Source: Public Records
Mortgage History
We collect this data history from publicly available records. To have your information removed, we recommend requesting removal directly through your county’s website.
| Date | Status | Borrower | Loan Amount |
|---|---|---|---|
| Previous Owner | Stone Peter D | $262,500 | |
| Previous Owner | Foote Richard L | $284,500 | |
| Closed | Stone Peter D | $52,499 |
Source: Public Records
Tax History
| Year | Tax Paid | Tax Assessment Tax Assessment Total Assessment is a certain percentage of the fair market value that is determined by local assessors to be the total taxable value of land and additions on the property. | Land | Improvement |
|---|---|---|---|---|
| 2025 | $7,124 | $548,677 | $297,854 | $250,823 |
| 2024 | $6,850 | $537,919 | $292,014 | $245,905 |
| 2023 | $6,850 | $527,373 | $286,289 | $241,084 |
| 2022 | $6,708 | $517,033 | $280,676 | $236,357 |
| 2021 | $6,526 | $506,896 | $275,173 | $231,723 |
| 2019 | $6,372 | $491,862 | $267,012 | $224,850 |
| 2018 | $6,157 | $482,219 | $261,777 | $220,442 |
| 2017 | $6,035 | $472,765 | $256,645 | $216,120 |
| 2016 | $5,912 | $463,496 | $251,613 | $211,883 |
| 2015 | $5,771 | $456,535 | $247,834 | $208,701 |
| 2014 | $5,694 | $447,593 | $242,980 | $204,613 |
Source: Public Records
Map
Nearby Homes
- 2450 San Miguel Dr
- 861 Holly Hill Dr
- 1276 Lindell Dr
- 1957 Whitecliff Ct
- 1283 Rudgear Rd
- 1237 Mountain View Blvd
- 1490 Whitecliff Way
- 1127 Glengarry Dr
- 2144 Wilmington Dr
- 1977 Woodbury Ct
- 24 Blackwood Ct
- 2216 San Miguel Dr
- 2064 Celeste Ave
- 1740 Oro Valley Cir
- 172 Rudgear Dr
- 1782 Whitecliff Way
- 1225 Worchester Ct
- 29 Mcconnell Ln
- 44 Lariat Ct
- 2095 Robb Rd
Your Personal Tour Guide
Ask me questions while you tour the home.