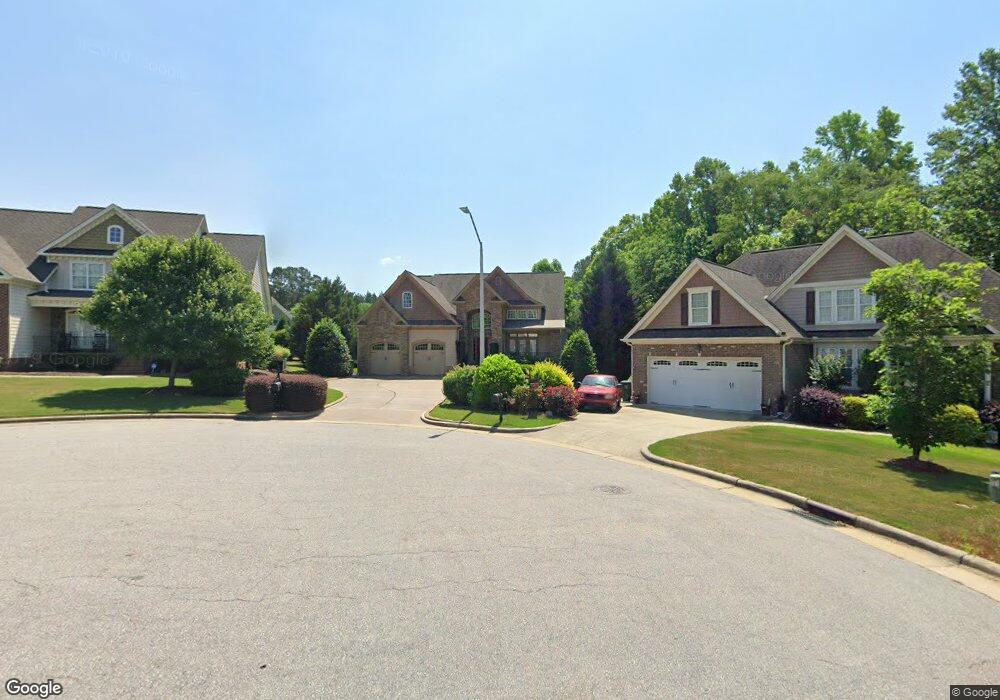
109 Thistletree Ct Garner, NC 27529
White Oak NeighborhoodEstimated Value: $618,000 - $746,000
4
Beds
4
Baths
3,312
Sq Ft
$199/Sq Ft
Est. Value
About This Home
This home is located at 109 Thistletree Ct, Garner, NC 27529 and is currently estimated at $658,819, approximately $198 per square foot. 109 Thistletree Ct is a home located in Wake County with nearby schools including Bryan Road Elementary, East Garner Middle School, and South Garner High.
Ownership History
Date
Name
Owned For
Owner Type
Purchase Details
Closed on
Oct 29, 2010
Sold by
Loflin Danny and Loflin Angela
Bought by
Dyke John Wesley and Dyke Nicole Brooks
Current Estimated Value
Home Financials for this Owner
Home Financials are based on the most recent Mortgage that was taken out on this home.
Original Mortgage
$271,200
Outstanding Balance
$171,787
Interest Rate
3.5%
Mortgage Type
New Conventional
Estimated Equity
$487,032
Purchase Details
Closed on
May 4, 2007
Sold by
Rbs Holdings Llc
Bought by
Loflin Danny and Loflin Angela
Purchase Details
Closed on
May 2, 2006
Sold by
South Park Development Co Inc
Bought by
Rbs Holdings Llc
Home Financials for this Owner
Home Financials are based on the most recent Mortgage that was taken out on this home.
Original Mortgage
$284,000
Interest Rate
6.28%
Mortgage Type
Construction
Create a Home Valuation Report for This Property
The Home Valuation Report is an in-depth analysis detailing your home's value as well as a comparison with similar homes in the area
Home Values in the Area
Average Home Value in this Area
Purchase History
| Date | Buyer | Sale Price | Title Company |
|---|---|---|---|
| Dyke John Wesley | $339,000 | None Available | |
| Loflin Danny | $385,000 | None Available | |
| Rbs Holdings Llc | $122,000 | None Available |
Source: Public Records
Mortgage History
| Date | Status | Borrower | Loan Amount |
|---|---|---|---|
| Open | Dyke John Wesley | $271,200 | |
| Previous Owner | Rbs Holdings Llc | $284,000 |
Source: Public Records
Tax History
| Year | Tax Paid | Tax Assessment Tax Assessment Total Assessment is a certain percentage of the fair market value that is determined by local assessors to be the total taxable value of land and additions on the property. | Land | Improvement |
|---|---|---|---|---|
| 2025 | $6,442 | $619,233 | $105,000 | $514,233 |
| 2024 | $6,420 | $619,233 | $105,000 | $514,233 |
Source: Public Records
Map
Nearby Homes
- 136 Durie Way
- 105 Foxbury Dr
- 348 Anton Way
- 7626 White Oak Rd
- 703 Leah Ln
- 7460 Bryan Rd
- 722 Hillandale Ln
- 105 Valleycruise Cir
- 128 Dereham Ln
- 325 Bainbridge Cir
- 183 Axis Deer Ln
- 205 November St
- 206 November St
- 168 Whitetail Deer Ln
- 2290 Salt Hill Rd
- 158 Whitetail Deer Ln
- 144 Velvet Ridge Way
- 111 Tarpley Way
- 1709 Clifford Rd
- 101 Painted Rock Ct
- 117 Thistletree Ct
- 109 Twinberry Ln
- 115 Coffeeberry Ct
- 103 Twinberry Ln
- 101 Coffeeberry Ct
- 116 Thistletree Ct
- 127 Twinberry Ln
- 108 Thistletree Ct
- 100 Thistletree Ct
- 140 Tallowwood Dr
- 112 Twinberry Ln
- 100 Coffeeberry Ct
- 148 Tallowwood Dr
- 106 Twinberry Ln
- 118 Twinberry Ln
- 156 Tallowwood Dr
- 135 Coffeeberry Ct
- 132 Tallowwood Dr
- 124 Twinberry Ln
- 116 Coffeeberry Ct
Your Personal Tour Guide
Ask me questions while you tour the home.