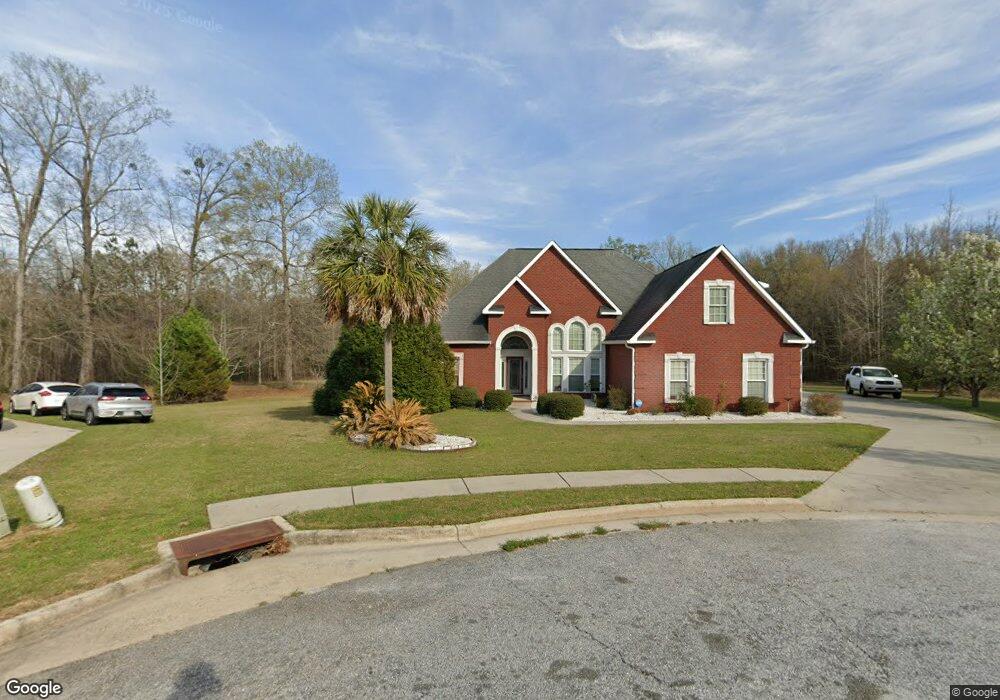
109 Tranquill Pointe Warner Robins, GA 31088
Estimated Value: $328,000 - $358,000
3
Beds
3
Baths
2,456
Sq Ft
$140/Sq Ft
Est. Value
About This Home
This home is located at 109 Tranquill Pointe, Warner Robins, GA 31088 and is currently estimated at $343,817, approximately $139 per square foot. 109 Tranquill Pointe is a home located in Houston County with nearby schools including Shirley Hills Elementary School, Warner Robins Middle School, and Warner Robins High School.
Ownership History
Date
Name
Owned For
Owner Type
Purchase Details
Closed on
Sep 9, 2011
Sold by
Cb & T Of Middle Georgia
Bought by
Mcentee Eric
Current Estimated Value
Purchase Details
Closed on
Mar 29, 2007
Sold by
Primo Homes Inc
Bought by
Mcentee John P and Mcentee Doreen J
Home Financials for this Owner
Home Financials are based on the most recent Mortgage that was taken out on this home.
Original Mortgage
$185,000
Interest Rate
6.27%
Mortgage Type
New Conventional
Create a Home Valuation Report for This Property
The Home Valuation Report is an in-depth analysis detailing your home's value as well as a comparison with similar homes in the area
Home Values in the Area
Average Home Value in this Area
Purchase History
| Date | Buyer | Sale Price | Title Company |
|---|---|---|---|
| Mcentee Eric | -- | None Available | |
| Mcentee John P | $233,400 | None Available |
Source: Public Records
Mortgage History
| Date | Status | Borrower | Loan Amount |
|---|---|---|---|
| Previous Owner | Mcentee John P | $185,000 |
Source: Public Records
Tax History
| Year | Tax Paid | Tax Assessment Tax Assessment Total Assessment is a certain percentage of the fair market value that is determined by local assessors to be the total taxable value of land and additions on the property. | Land | Improvement |
|---|---|---|---|---|
| 2025 | $3,406 | $119,480 | $10,000 | $109,480 |
| 2024 | $3,802 | $117,560 | $10,000 | $107,560 |
| 2023 | $3,564 | $109,480 | $10,000 | $99,480 |
| 2022 | $2,230 | $99,000 | $10,000 | $89,000 |
| 2021 | $2,037 | $90,120 | $10,000 | $80,120 |
| 2020 | $1,995 | $87,880 | $10,000 | $77,880 |
| 2019 | $1,995 | $87,880 | $10,000 | $77,880 |
| 2018 | $1,995 | $87,880 | $10,000 | $77,880 |
| 2017 | $1,997 | $87,880 | $10,000 | $77,880 |
| 2016 | $2,000 | $87,880 | $10,000 | $77,880 |
| 2015 | -- | $87,880 | $10,000 | $77,880 |
| 2014 | $934 | $87,880 | $10,000 | $77,880 |
| 2013 | $934 | $93,480 | $15,600 | $77,880 |
Source: Public Records
Map
Nearby Homes
- 222 Blue Ridge Ln
- 116 Elk Run
- 225 Blue Ridge Ln
- 316 Ridgestone Dr
- 111 Turtle Creek Dr
- 101 Buckskin Dr
- 103 Sandy Valley Dr
- 302 Creek Ridge Dr
- 203 Cumberland Woods Terrace
- 104 Sandy Run Dr
- 101 Sunnybrook Ct
- 201 Bayside Dr
- 409 Tucker Place
- 105 Sandy Springs Dr
- 134 Shenandoah Trail
- 203 Lattice Bend
- 212 Wynfield Ln
- 230 Tucker Rd
- 106 Idlewood Ct
- 226 Shenandoah Trail
- 111 Tranquill Pointe
- 107 Tranquill Pointe
- 107 Tranquill Point
- 110 Tranquill Pointe
- 105 Tranquill Pointe
- 108 Tranquil Pointe
- 108 Tranquill Pointe Unit 24
- 108 Tranquill Pointe
- 108 Tranquill Pointe
- 103 Tranquill Pointe
- 103 Tranquill Pointe
- 106 Tranquill Pointe
- 604 Woods Edge Way
- 602 Woods Edge Way
- 606 Woods Edge Way
- 612 Woods Edge Way
- 614 Woods Edge Way
- 101 Tranquill Pointe
- 615 Woods Edge Way Unit 49
- 615 Woods Edge Way
Your Personal Tour Guide
Ask me questions while you tour the home.