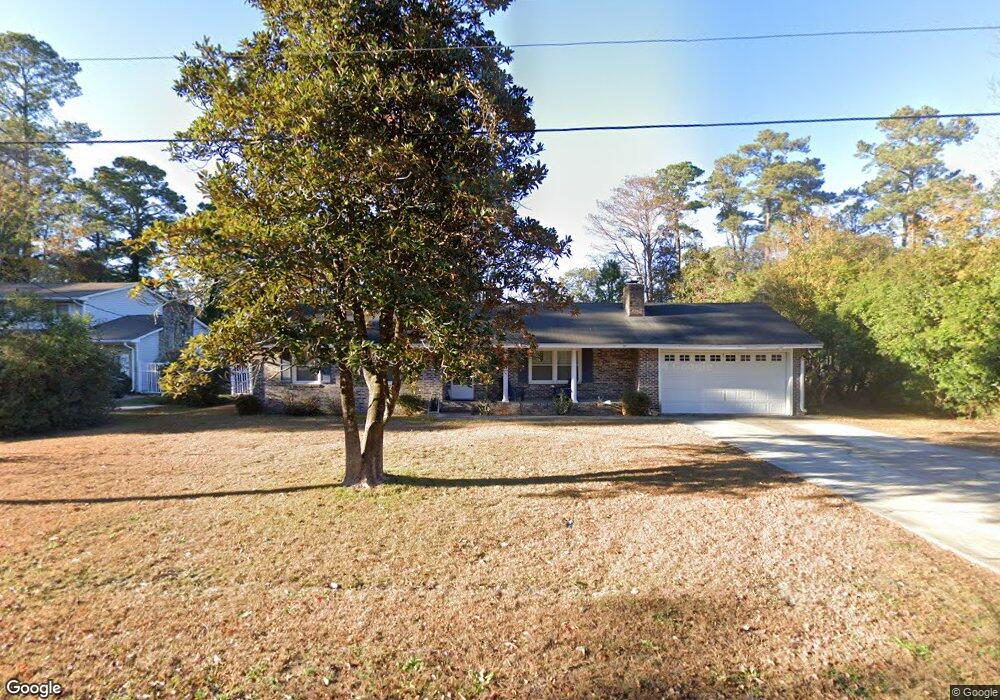
109 University Cir Conway, SC 29526
Estimated Value: $265,000 - $322,000
3
Beds
2
Baths
1,378
Sq Ft
$209/Sq Ft
Est. Value
About This Home
This home is located at 109 University Cir, Conway, SC 29526 and is currently estimated at $288,310, approximately $209 per square foot. 109 University Cir is a home located in Horry County with nearby schools including Palmetto Bays Elementary School, Black Water Middle School, and Carolina Forest High School.
Ownership History
Date
Name
Owned For
Owner Type
Purchase Details
Closed on
Nov 21, 2005
Sold by
G J Creel Inc
Bought by
Hemsing Michael K and Hemsing Elizabeth C
Current Estimated Value
Purchase Details
Closed on
May 31, 2002
Sold by
Sarajian Jeffrey S and Sarajian Mona S
Bought by
G J Creel Inc
Home Financials for this Owner
Home Financials are based on the most recent Mortgage that was taken out on this home.
Original Mortgage
$113,612
Interest Rate
6.77%
Mortgage Type
Purchase Money Mortgage
Purchase Details
Closed on
Dec 29, 1998
Sold by
Sarajian Jeffrey and Sarajian Mona S
Bought by
Barefoot Luther A
Purchase Details
Closed on
Aug 31, 1998
Sold by
Balsamo Peter P and Balsamo Barbara S
Bought by
Sarajian Jeffrey and Sarajian Mona S
Home Financials for this Owner
Home Financials are based on the most recent Mortgage that was taken out on this home.
Original Mortgage
$108,000
Interest Rate
7.5%
Mortgage Type
Purchase Money Mortgage
Create a Home Valuation Report for This Property
The Home Valuation Report is an in-depth analysis detailing your home's value as well as a comparison with similar homes in the area
Home Values in the Area
Average Home Value in this Area
Purchase History
| Date | Buyer | Sale Price | Title Company |
|---|---|---|---|
| Hemsing Michael K | $180,000 | -- | |
| G J Creel Inc | $142,000 | -- | |
| Barefoot Luther A | $12,000 | -- | |
| Sarajian Jeffrey | $120,000 | -- |
Source: Public Records
Mortgage History
| Date | Status | Borrower | Loan Amount |
|---|---|---|---|
| Previous Owner | G J Creel Inc | $113,612 | |
| Previous Owner | Sarajian Jeffrey | $108,000 |
Source: Public Records
Tax History Compared to Growth
Tax History
| Year | Tax Paid | Tax Assessment Tax Assessment Total Assessment is a certain percentage of the fair market value that is determined by local assessors to be the total taxable value of land and additions on the property. | Land | Improvement |
|---|---|---|---|---|
| 2024 | $688 | $9,813 | $3,600 | $6,213 |
| 2023 | $688 | $5,658 | $1,590 | $4,068 |
| 2021 | $625 | $5,658 | $1,590 | $4,068 |
| 2020 | $537 | $5,658 | $1,590 | $4,068 |
| 2019 | $537 | $5,658 | $1,590 | $4,068 |
| 2018 | $492 | $5,002 | $1,398 | $3,604 |
| 2017 | $477 | $5,002 | $1,398 | $3,604 |
| 2016 | -- | $5,002 | $1,398 | $3,604 |
| 2015 | $477 | $5,002 | $1,398 | $3,604 |
| 2014 | $441 | $5,002 | $1,398 | $3,604 |
Source: Public Records
Map
Nearby Homes
- 128 Clemson Rd
- 118 Clemson Rd
- 480 Myrtle Greens Dr Unit G
- 208 Lander Dr
- 1109 Woodford Ct
- 212 Lander Dr
- 2311 S Carolina 544 Unit Kingswood
- 650 Woodman Dr
- 2430 E Highway 501
- 300-J Myrtle Greens Dr Unit 300 J
- Lot 11 Professional Park Dr
- 221 Lander Dr
- TBD University Plaza Dr Unit Parcel B
- 1025 Carolina Rd Unit G-3
- 1025 Carolina Rd Unit R1
- 1025 Carolina Rd Unit CC2
- 1025 Carolina Rd Unit EE-3
- 1025 Carolina Rd Unit M-3
- 804 Wylie Ct
- 615 Carter Ln Unit B1
- 111 University Cir
- 107 University Cir
- 113 University Cir
- 110 University Cir
- 106 University Cir
- 128 University Cir
- 639 University Cir
- 105 University Cir
- 108 University Cir
- 108 University Cir Unit Coastal Heights
- 112 University Cir
- 122 University Cir
- 122 University Cir
- 104 University Cir
- 104 University Cir
- 111 University Dr
- 124 University Cir
- 119 University Cir
- 102 University Cir
- 136 University Cir