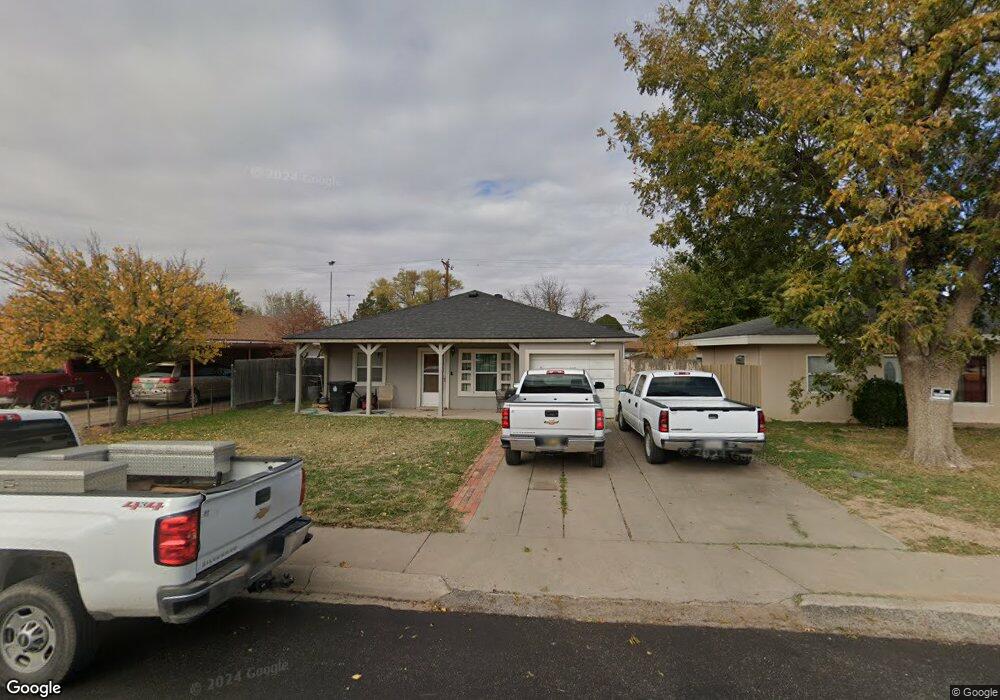
109 W Chisum St Roswell, NM 88203
Estimated Value: $75,000 - $136,000
--
Bed
--
Bath
1,362
Sq Ft
$85/Sq Ft
Est. Value
About This Home
This home is located at 109 W Chisum St, Roswell, NM 88203 and is currently estimated at $115,686, approximately $84 per square foot. 109 W Chisum St is a home located in Chaves County with nearby schools including Valley View Elementary School, Sierra Middle School, and Roswell High School.
Ownership History
Date
Name
Owned For
Owner Type
Purchase Details
Closed on
Nov 15, 2013
Sold by
Smith Rex and Smith La Verne
Bought by
Maldonado Pablo and Maldonado Maria
Current Estimated Value
Purchase Details
Closed on
Dec 12, 2007
Sold by
Smith Rex and Smith Laverne
Bought by
Maldonado Pablo and Maldonado Maria
Home Financials for this Owner
Home Financials are based on the most recent Mortgage that was taken out on this home.
Original Mortgage
$52,200
Interest Rate
4.84%
Mortgage Type
Seller Take Back
Purchase Details
Closed on
Dec 10, 2004
Sold by
Smith Rex and Smith Laverne
Bought by
Maldonado Pablo and Maldonado Maria
Create a Home Valuation Report for This Property
The Home Valuation Report is an in-depth analysis detailing your home's value as well as a comparison with similar homes in the area
Home Values in the Area
Average Home Value in this Area
Purchase History
| Date | Buyer | Sale Price | Title Company |
|---|---|---|---|
| Maldonado Pablo | -- | None Available | |
| Maldonado Pablo | $58,000 | None Available | |
| Maldonado Pablo | -- | None Available |
Source: Public Records
Mortgage History
| Date | Status | Borrower | Loan Amount |
|---|---|---|---|
| Previous Owner | Maldonado Pablo | $52,200 |
Source: Public Records
Tax History Compared to Growth
Tax History
| Year | Tax Paid | Tax Assessment Tax Assessment Total Assessment is a certain percentage of the fair market value that is determined by local assessors to be the total taxable value of land and additions on the property. | Land | Improvement |
|---|---|---|---|---|
| 2025 | $682 | $25,819 | $1,816 | $24,003 |
| 2024 | $682 | $25,067 | $1,804 | $23,263 |
| 2023 | $683 | $24,337 | $1,794 | $22,543 |
| 2022 | $657 | $23,629 | $1,742 | $21,887 |
| 2021 | $652 | $22,941 | $1,704 | $21,237 |
| 2020 | $633 | $22,272 | $1,650 | $20,622 |
| 2019 | $614 | $21,624 | $1,590 | $20,034 |
| 2018 | $595 | $20,995 | $1,542 | $19,453 |
| 2017 | $572 | $20,383 | $1,500 | $18,883 |
| 2016 | $577 | $20,754 | $1,460 | $19,294 |
| 2015 | $616 | $20,149 | $1,382 | $18,767 |
| 2014 | $1,197 | $19,562 | $1,318 | $18,244 |
Source: Public Records
Map
Nearby Homes
- 112 W Wildy St
- 305 W Wildy St
- 1502 S Kentucky Ave
- 1516 S Kentucky Ave
- 1405 S Lea Ave
- 1403 S Lea Ave
- 1400 S Lea Ave
- 1800 S Pennsylvania Ave
- 1506 Stanton 1 2 Ave
- 1010 S Pennsylvania Ave
- 1007 S Pennsylvania Ave
- 1107 S Missouri Ave
- 316 E Jefferson St
- 900 S Missouri Ave
- 303 W Mathews St
- 111 W Mathews St
- 613 W Van Buren St
- 1614 Mesa Dr
- 1520 S Garden Ave
- 1509 S Poplar Ave