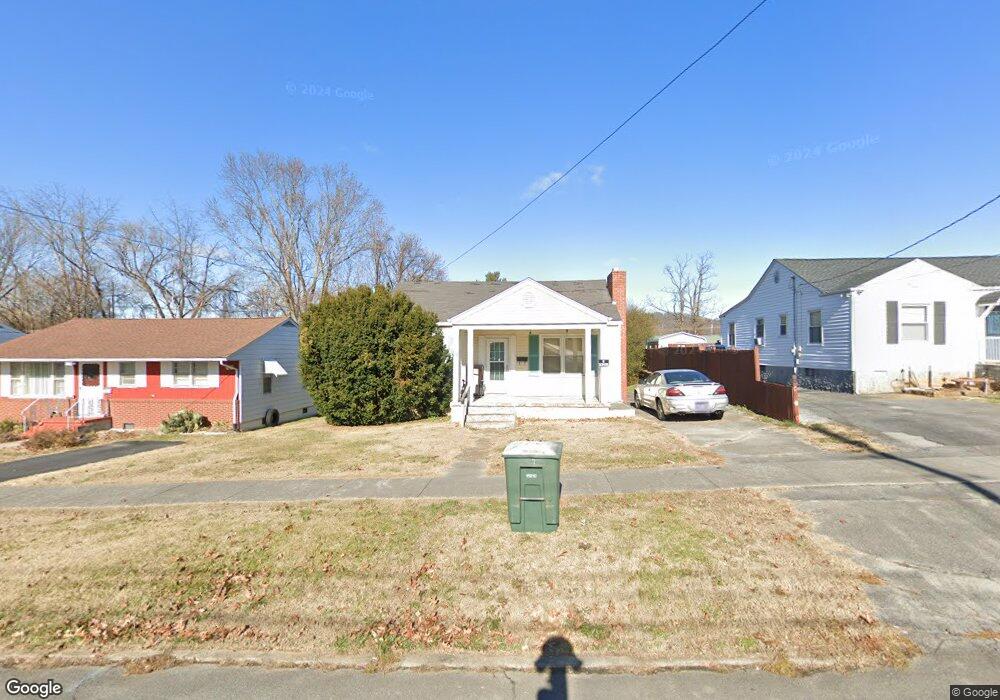
109 W E St Elizabethton, TN 37643
Estimated Value: $180,000 - $218,197
3
Beds
1
Bath
1,200
Sq Ft
$168/Sq Ft
Est. Value
About This Home
This home is located at 109 W E St, Elizabethton, TN 37643 and is currently estimated at $201,049, approximately $167 per square foot. 109 W E St is a home located in Carter County with nearby schools including Elizabethton High School and East Tn Christian Home & Academy.
Ownership History
Date
Name
Owned For
Owner Type
Purchase Details
Closed on
Jun 12, 2009
Sold by
Collins Violet R
Bought by
Hicks Martin W
Current Estimated Value
Home Financials for this Owner
Home Financials are based on the most recent Mortgage that was taken out on this home.
Original Mortgage
$70,695
Outstanding Balance
$44,714
Interest Rate
4.79%
Estimated Equity
$156,335
Purchase Details
Closed on
Aug 22, 2000
Sold by
Minton Jack
Bought by
Collins Violet R
Purchase Details
Closed on
Aug 22, 1972
Bought by
Hamilton Elizabeth and Hamilton Robert
Create a Home Valuation Report for This Property
The Home Valuation Report is an in-depth analysis detailing your home's value as well as a comparison with similar homes in the area
Home Values in the Area
Average Home Value in this Area
Purchase History
| Date | Buyer | Sale Price | Title Company |
|---|---|---|---|
| Hicks Martin W | $72,000 | -- | |
| Collins Violet R | -- | -- | |
| Hamilton Elizabeth | -- | -- |
Source: Public Records
Mortgage History
| Date | Status | Borrower | Loan Amount |
|---|---|---|---|
| Open | Hamilton Elizabeth | $70,695 | |
| Closed | Hamilton Elizabeth | $4,752 |
Source: Public Records
Tax History Compared to Growth
Tax History
| Year | Tax Paid | Tax Assessment Tax Assessment Total Assessment is a certain percentage of the fair market value that is determined by local assessors to be the total taxable value of land and additions on the property. | Land | Improvement |
|---|---|---|---|---|
| 2024 | $904 | $27,400 | $5,400 | $22,000 |
| 2023 | $904 | $27,400 | $0 | $0 |
| 2022 | $986 | $27,400 | $5,400 | $22,000 |
| 2021 | $556 | $27,400 | $5,400 | $22,000 |
| 2020 | $888 | $27,400 | $5,400 | $22,000 |
| 2019 | $888 | $20,550 | $2,825 | $17,725 |
| 2018 | $876 | $20,550 | $2,825 | $17,725 |
| 2017 | $876 | $20,550 | $2,825 | $17,725 |
| 2016 | $871 | $20,550 | $2,825 | $17,725 |
| 2015 | $873 | $20,550 | $2,825 | $17,725 |
| 2014 | $895 | $20,950 | $2,825 | $18,125 |
Source: Public Records
Map
Nearby Homes