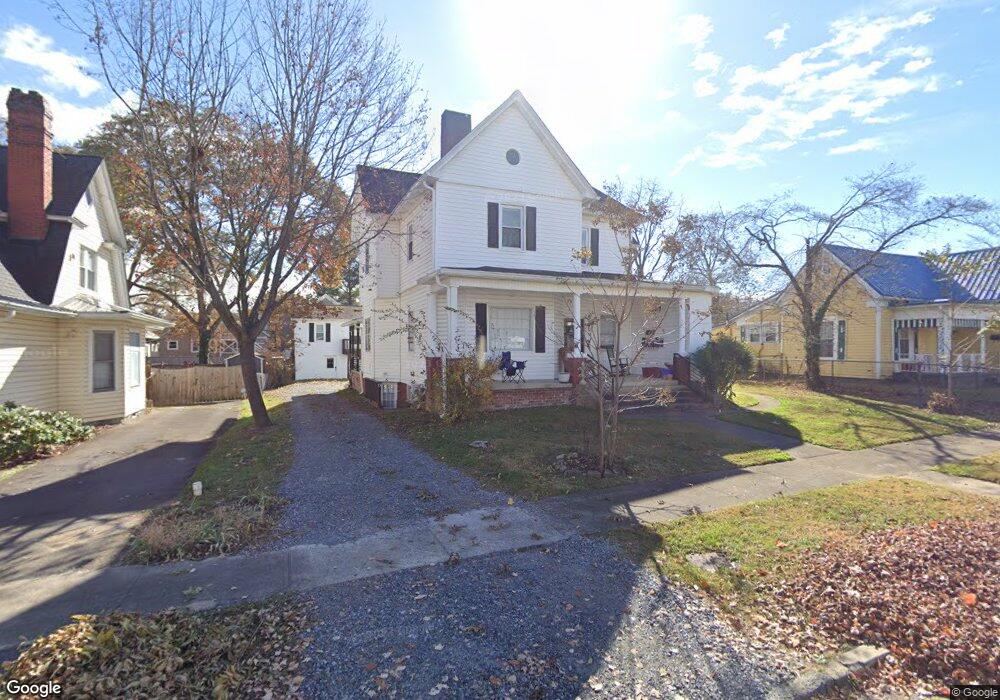
109 W Maple St Johnson City, TN 37604
South Side Johnson City NeighborhoodEstimated Value: $359,783 - $365,000
--
Bed
5
Baths
3,408
Sq Ft
$106/Sq Ft
Est. Value
About This Home
This home is located at 109 W Maple St, Johnson City, TN 37604 and is currently estimated at $362,392, approximately $106 per square foot. 109 W Maple St is a home located in Washington County with nearby schools including South Side Elementary School, Liberty Bell Middle School, and Indian Trail Middle School.
Ownership History
Date
Name
Owned For
Owner Type
Purchase Details
Closed on
Feb 23, 2021
Sold by
Wsj Investments Llc
Bought by
W Maple Llc
Current Estimated Value
Home Financials for this Owner
Home Financials are based on the most recent Mortgage that was taken out on this home.
Original Mortgage
$194,000
Outstanding Balance
$158,987
Interest Rate
2.7%
Mortgage Type
Commercial
Estimated Equity
$203,405
Purchase Details
Closed on
Aug 10, 2020
Sold by
Mcneil Mary B
Bought by
Overmountain Development Llc
Purchase Details
Closed on
Nov 15, 2019
Sold by
Ramsey Greg
Bought by
Wsj Investments Llc
Home Financials for this Owner
Home Financials are based on the most recent Mortgage that was taken out on this home.
Original Mortgage
$196,600
Interest Rate
3.65%
Mortgage Type
Commercial
Purchase Details
Closed on
Mar 30, 2015
Sold by
Taylor Wayne W
Bought by
Ramsey Greg
Home Financials for this Owner
Home Financials are based on the most recent Mortgage that was taken out on this home.
Original Mortgage
$110,000
Interest Rate
3.89%
Mortgage Type
New Conventional
Purchase Details
Closed on
Jan 6, 2014
Sold by
Maupin Tim
Bought by
Booth Joe Ward
Purchase Details
Closed on
Apr 22, 1996
Sold by
Taylor Wayne W and Taylor Ellen Lou
Bought by
Mary Mcneil
Create a Home Valuation Report for This Property
The Home Valuation Report is an in-depth analysis detailing your home's value as well as a comparison with similar homes in the area
Home Values in the Area
Average Home Value in this Area
Purchase History
| Date | Buyer | Sale Price | Title Company |
|---|---|---|---|
| W Maple Llc | -- | None Available | |
| Overmountain Development Llc | $25,000 | Tri City Title Company Inc | |
| Wsj Investments Llc | $202,000 | None Available | |
| Ramsey Greg | $137,500 | -- | |
| Booth Joe Ward | $4,688 | -- | |
| Mary Mcneil | $86,000 | -- |
Source: Public Records
Mortgage History
| Date | Status | Borrower | Loan Amount |
|---|---|---|---|
| Open | W Maple Llc | $194,000 | |
| Previous Owner | Wsj Investments Llc | $196,600 | |
| Previous Owner | Ramsey Greg | $110,000 |
Source: Public Records
Tax History Compared to Growth
Tax History
| Year | Tax Paid | Tax Assessment Tax Assessment Total Assessment is a certain percentage of the fair market value that is determined by local assessors to be the total taxable value of land and additions on the property. | Land | Improvement |
|---|---|---|---|---|
| 2024 | $2,394 | $140,000 | $13,640 | $126,360 |
| 2022 | $1,763 | $82,000 | $7,160 | $74,840 |
| 2021 | $3,182 | $82,000 | $7,160 | $74,840 |
| 2020 | $3,165 | $82,000 | $7,160 | $74,840 |
| 2019 | $1,487 | $82,000 | $7,160 | $74,840 |
| 2018 | $2,668 | $62,480 | $7,160 | $55,320 |
| 2017 | $2,668 | $62,480 | $7,160 | $55,320 |
| 2016 | $2,655 | $62,480 | $7,160 | $55,320 |
| 2015 | $2,405 | $62,480 | $7,160 | $55,320 |
| 2014 | $2,249 | $62,480 | $7,160 | $55,320 |
Source: Public Records
Map
Nearby Homes
- 102 E Walnut St
- 1007 Spring St
- 102 W Locust St
- 203 E Locust St
- 116 Tipton St Unit 209
- 414 S Roan St Unit 202
- 200 E Main St Unit 5
- 112 W Chestnut St
- 900 Grover St
- 403 W Poplar St
- 908 Afton St
- 433 W Poplar St
- 106 Water St
- 300 Peach Blossom Ct
- 302 Wilson Ave
- 707 W Maple St
- 116 E Unaka Ave
- 805 E Maple St
- 120 E Holston Ave
- 423 Wilson Ave
- 109 W Maple St
- 109 W Maple St
- 109 W Maple St Unit 5
- 107 W Maple St
- 111 W Maple St
- 105 W Maple St
- 113 W Maple St
- 103 W Maple St
- 108 W W Pine St
- 114 W Pine St
- 112 W Maple St Unit 4
- 112 W Maple St Unit 2
- 112 W Maple St
- 116 W Pine St
- 901 Spring St
- 903 Spring St
- 110 Maplewest
- 106 W Pine St
- 110 W Maple St
- 114 W Maple St