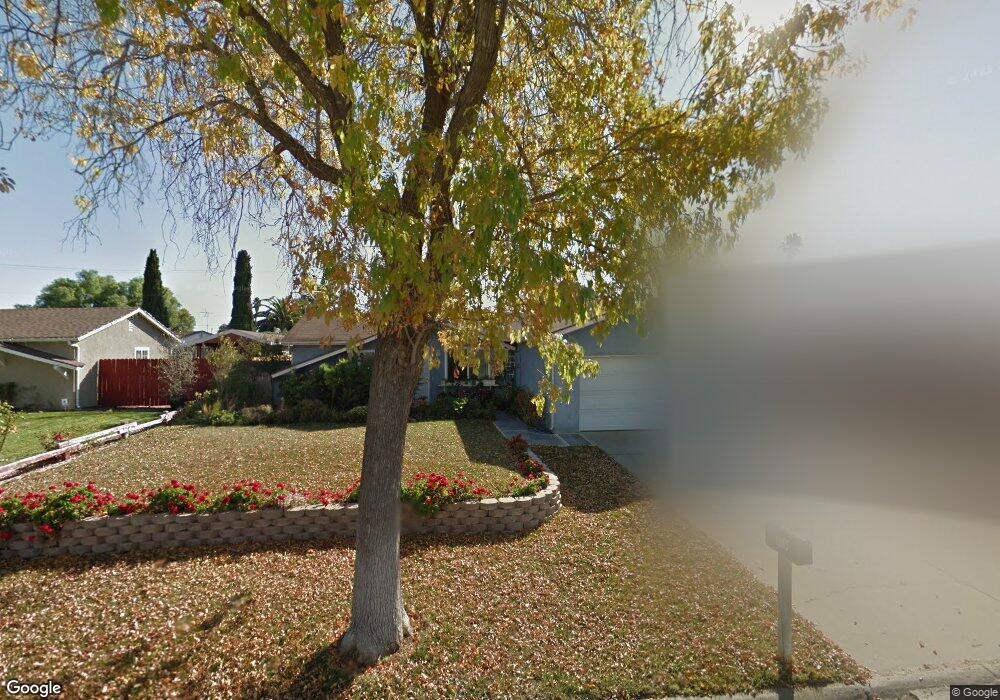
109 W Price St Nipomo, CA 93444
Estimated Value: $570,000 - $685,000
4
Beds
3
Baths
1,400
Sq Ft
$448/Sq Ft
Est. Value
About This Home
This home is located at 109 W Price St, Nipomo, CA 93444 and is currently estimated at $627,852, approximately $448 per square foot. 109 W Price St is a home located in San Luis Obispo County with nearby schools including Nipomo Elementary School, Mesa Middle School, and Nipomo High School.
Ownership History
Date
Name
Owned For
Owner Type
Purchase Details
Closed on
Feb 24, 2000
Sold by
Requenez Bernice M
Bought by
Pinette William R and Pinette Imelda A
Current Estimated Value
Home Financials for this Owner
Home Financials are based on the most recent Mortgage that was taken out on this home.
Original Mortgage
$110,400
Interest Rate
8.22%
Purchase Details
Closed on
Jul 30, 1998
Sold by
Requenez Bernice M
Bought by
Requenez Bernice M
Purchase Details
Closed on
Jul 28, 1995
Sold by
Flores Bernice U and Flores Bernice Uribe
Bought by
Requenez Bernice
Home Financials for this Owner
Home Financials are based on the most recent Mortgage that was taken out on this home.
Original Mortgage
$82,500
Interest Rate
7.71%
Create a Home Valuation Report for This Property
The Home Valuation Report is an in-depth analysis detailing your home's value as well as a comparison with similar homes in the area
Home Values in the Area
Average Home Value in this Area
Purchase History
| Date | Buyer | Sale Price | Title Company |
|---|---|---|---|
| Pinette William R | $138,000 | First American Title | |
| Requenez Bernice M | -- | -- | |
| Requenez Bernice | -- | First American Title Co |
Source: Public Records
Mortgage History
| Date | Status | Borrower | Loan Amount |
|---|---|---|---|
| Previous Owner | Pinette William R | $110,400 | |
| Previous Owner | Requenez Bernice | $82,500 |
Source: Public Records
Tax History Compared to Growth
Tax History
| Year | Tax Paid | Tax Assessment Tax Assessment Total Assessment is a certain percentage of the fair market value that is determined by local assessors to be the total taxable value of land and additions on the property. | Land | Improvement |
|---|---|---|---|---|
| 2025 | $2,108 | $212,078 | $92,205 | $119,873 |
| 2024 | $2,082 | $207,921 | $90,398 | $117,523 |
| 2023 | $2,082 | $203,845 | $88,626 | $115,219 |
| 2022 | $2,050 | $199,849 | $86,889 | $112,960 |
| 2021 | $2,044 | $195,932 | $85,186 | $110,746 |
| 2020 | $2,020 | $193,924 | $84,313 | $109,611 |
| 2019 | $2,006 | $190,122 | $82,660 | $107,462 |
| 2018 | $1,981 | $186,395 | $81,040 | $105,355 |
| 2017 | $1,942 | $182,741 | $79,451 | $103,290 |
| 2016 | $1,830 | $179,159 | $77,894 | $101,265 |
| 2015 | $1,803 | $176,468 | $76,724 | $99,744 |
| 2014 | $1,735 | $173,013 | $75,222 | $97,791 |
Source: Public Records
Map
Nearby Homes
- 0 S Burton St
- 90111003 W Price St
- 189 E Tefft St
- 1 W Branch St
- 150 E Chestnut St
- 285 E Tefft St
- 449 W Tefft St Unit 23
- 449 W Tefft St Unit 13
- 412 N Mallagh St
- 400 N Oakglen Ave
- 160 San Antonio Ln
- 525 Grande Ave Unit D
- 450 Avenida de Socios Unit 12
- 368 Avenida de Amigos
- 424 Bermuda Place
- 626 Juno Ct
- Mesa Plan at Hill Street Terraces - Hill Street Series
- Pacific Plan at Hill Street Terraces - Hill Street Series
- Monarch Plan at Hill Street Terraces - Hill Street Series
- Rancho Plan at Hill Street Terraces - Hill Street Series
- 105 W Price St
- 113 W Price St
- 116 W Bennett St
- 120 W Bennett St
- 110 W Bennett St
- 200 S Burton St
- 101 W Price St
- 192194 W Price St
- 112 W Price St Unit A &
- 112 W Price St
- 124 W Bennett St
- 108 W Bennett St
- 144 W Price St
- 190 S Thompson Ave Unit A
- 190 S Thompson Ave
- 250 S Ballard St
- 256 S Ballard St
- 201 S Burton St
- 119 W Bennett St
- 205 S Burton St Unit 1