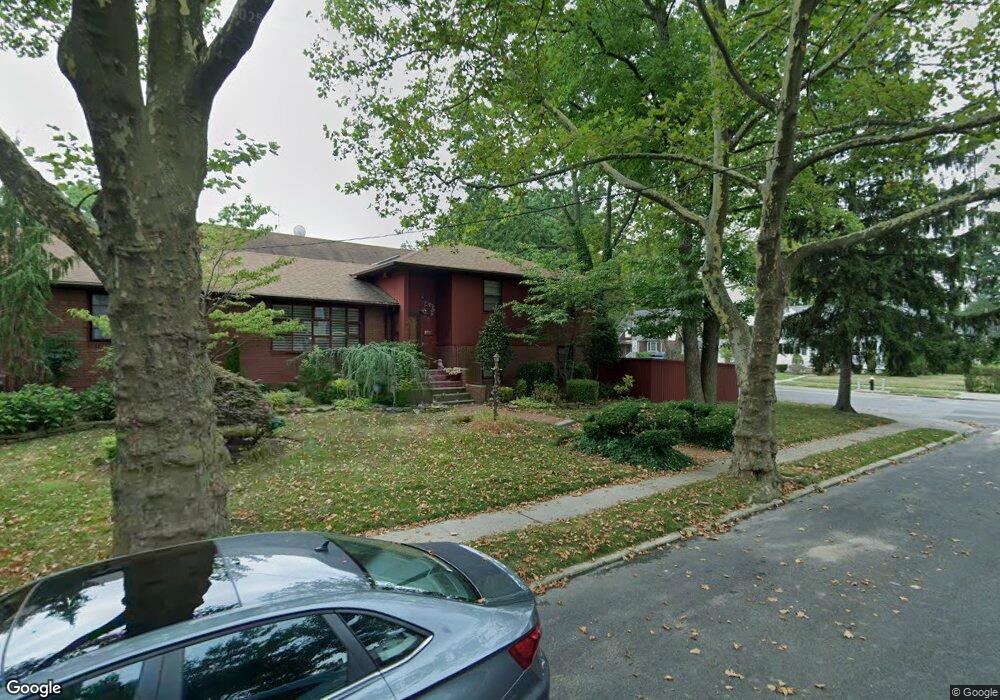
109 Westcott Blvd Staten Island, NY 10314
Westerleigh NeighborhoodEstimated Value: $1,015,481 - $1,235,000
4
Beds
4
Baths
3,276
Sq Ft
$337/Sq Ft
Est. Value
About This Home
This home is located at 109 Westcott Blvd, Staten Island, NY 10314 and is currently estimated at $1,103,120, approximately $336 per square foot. 109 Westcott Blvd is a home located in Richmond County with nearby schools including P.S. 30 Westerleigh, I.S. 51 Edwin Markham, and Susan E Wagner High School.
Ownership History
Date
Name
Owned For
Owner Type
Purchase Details
Closed on
Jan 30, 2025
Sold by
Andrianos Evangelia
Bought by
Huang Hanyu and Wen Shihan
Current Estimated Value
Home Financials for this Owner
Home Financials are based on the most recent Mortgage that was taken out on this home.
Original Mortgage
$580,000
Outstanding Balance
$565,980
Interest Rate
6.13%
Mortgage Type
New Conventional
Estimated Equity
$537,140
Purchase Details
Closed on
Oct 28, 2021
Sold by
Dipalma Family Living Trust and Dipalma Maria A
Bought by
Andrianos Evangelia
Home Financials for this Owner
Home Financials are based on the most recent Mortgage that was taken out on this home.
Original Mortgage
$200,000
Interest Rate
2.99%
Mortgage Type
New Conventional
Purchase Details
Closed on
Aug 31, 2018
Sold by
Dipalma Maria A
Bought by
Dipalma Raiph A and Dipalma Maria A
Purchase Details
Closed on
May 11, 1999
Sold by
Dipalma Ralph A and Dipalma Maria A
Bought by
Dipalma Maria A
Create a Home Valuation Report for This Property
The Home Valuation Report is an in-depth analysis detailing your home's value as well as a comparison with similar homes in the area
Home Values in the Area
Average Home Value in this Area
Purchase History
| Date | Buyer | Sale Price | Title Company |
|---|---|---|---|
| Huang Hanyu | $999,000 | Commonwealth Land Title | |
| Andrianos Evangelia | $999,000 | Stavropoulos George | |
| Dipalma Raiph A | -- | None Available | |
| Dipalma Maria A | -- | Fidelity National Title Ins |
Source: Public Records
Mortgage History
| Date | Status | Borrower | Loan Amount |
|---|---|---|---|
| Open | Huang Hanyu | $580,000 | |
| Previous Owner | Andrianos Evangelia | $200,000 |
Source: Public Records
Tax History Compared to Growth
Tax History
| Year | Tax Paid | Tax Assessment Tax Assessment Total Assessment is a certain percentage of the fair market value that is determined by local assessors to be the total taxable value of land and additions on the property. | Land | Improvement |
|---|---|---|---|---|
| 2025 | $5,488 | $73,560 | $17,593 | $55,967 |
| 2024 | $5,488 | $73,440 | $17,591 | $55,849 |
| 2023 | $5,517 | $54,329 | $18,860 | $35,469 |
| 2022 | $5,116 | $63,240 | $23,640 | $39,600 |
| 2021 | $9,873 | $52,380 | $23,640 | $28,740 |
| 2020 | $25,474 | $52,380 | $23,640 | $28,740 |
| 2019 | $28,204 | $45,540 | $23,640 | $21,900 |
| 2018 | $8,931 | $45,274 | $20,574 | $24,700 |
| 2017 | $4,285 | $42,712 | $19,321 | $23,391 |
| 2016 | $7,746 | $40,296 | $18,789 | $21,507 |
| 2015 | $6,991 | $38,016 | $20,059 | $17,957 |
| 2014 | $6,991 | $38,016 | $21,858 | $16,158 |
Source: Public Records
Map
Nearby Homes
- 125 Westcott Blvd
- 36 Sawyer Ave
- 160 Westcott Blvd
- 142 Margaretta Ct
- 751 Jewett Ave Unit 17
- 751 Jewett Ave
- 80 Kemball Ave
- 14 Leonard Ave
- 17 Carolina Place
- 328 Manor Rd
- 148 Sturges St
- 25 Coale Ave
- 136 Sturges St
- 254 Rice Ave
- 204 Utter Ave
- 138 Kingsley Ave
- 262 Maine Ave
- 48 Markham Place
- 122 Kingsley Ave
- 304 Kingsley Ave
- 117 Westcott Blvd
- 52 Margaretta Ct
- 119 Westcott Blvd
- 48 Margaretta Ct
- 97 Westcott Blvd
- 53 Sawyer Ave
- 51 Margaretta Ct
- 44 Margaretta Ct
- 49 Sawyer Ave
- 93 Westcott Blvd
- 116 Westcott Blvd
- 45 Margaretta Ct
- 76 Margaretta Ct
- 75 Margaretta Ct
- 87 Westcott Blvd
- 38 Margaretta Ct
- 75 Sawyer Ave
- 39 Sawyer Ave
- 41 Margaretta Ct
- 80 Margaretta Ct