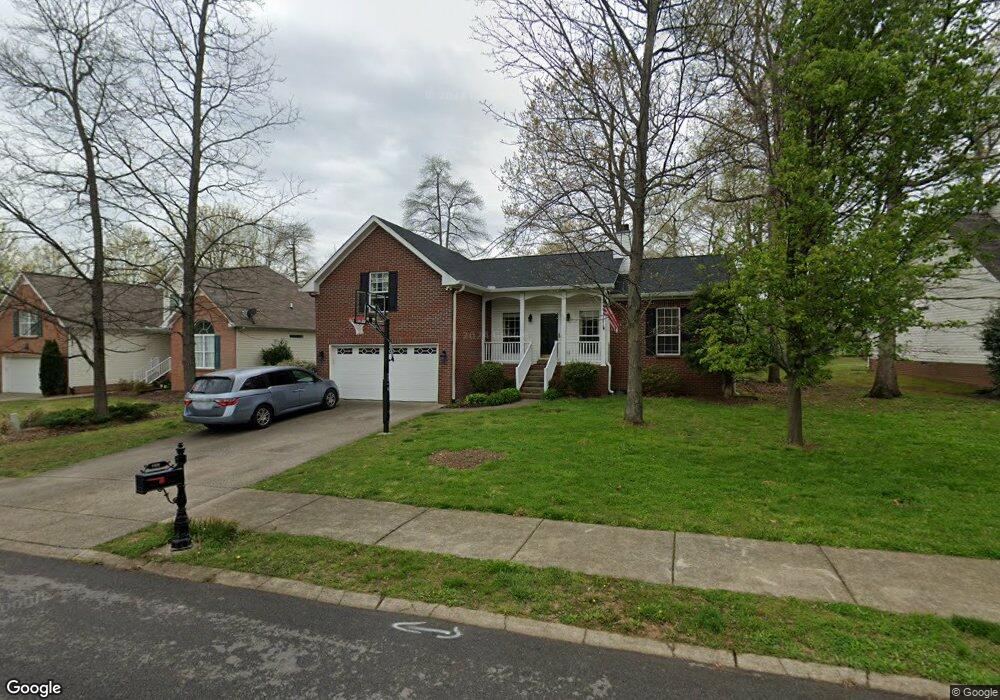
109 Willowleaf Ln White House, TN 37188
Estimated Value: $335,896 - $394,000
--
Bed
2
Baths
1,556
Sq Ft
$239/Sq Ft
Est. Value
About This Home
This home is located at 109 Willowleaf Ln, White House, TN 37188 and is currently estimated at $371,474, approximately $238 per square foot. 109 Willowleaf Ln is a home located in Robertson County with nearby schools including Robert F. Woodall Elementary School, White House Heritage Elementary School, and White House Heritage High School.
Ownership History
Date
Name
Owned For
Owner Type
Purchase Details
Closed on
Sep 28, 2007
Sold by
Thompson Michael P
Bought by
Bale David B and Bale Amy W
Current Estimated Value
Home Financials for this Owner
Home Financials are based on the most recent Mortgage that was taken out on this home.
Original Mortgage
$137,000
Outstanding Balance
$86,421
Interest Rate
6.41%
Estimated Equity
$285,053
Purchase Details
Closed on
Oct 31, 2005
Sold by
Etal Barfield Steve W
Bought by
Thompson Michael P
Home Financials for this Owner
Home Financials are based on the most recent Mortgage that was taken out on this home.
Original Mortgage
$131,520
Interest Rate
5.84%
Purchase Details
Closed on
Jun 29, 2001
Bought by
Barfield Steve W and Barfield Diedre D
Purchase Details
Closed on
Feb 16, 2001
Sold by
Balthrop James M Tr
Bought by
Goodall Inc Builders
Create a Home Valuation Report for This Property
The Home Valuation Report is an in-depth analysis detailing your home's value as well as a comparison with similar homes in the area
Home Values in the Area
Average Home Value in this Area
Purchase History
| Date | Buyer | Sale Price | Title Company |
|---|---|---|---|
| Bale David B | $179,500 | -- | |
| Thompson Michael P | $164,400 | -- | |
| Barfield Steve W | $142,400 | -- | |
| Goodall Inc Builders | $25,000 | -- |
Source: Public Records
Mortgage History
| Date | Status | Borrower | Loan Amount |
|---|---|---|---|
| Open | Goodall Inc Builders | $137,000 | |
| Previous Owner | Goodall Inc Builders | $131,520 | |
| Previous Owner | Goodall Inc Builders | $32,880 |
Source: Public Records
Tax History Compared to Growth
Tax History
| Year | Tax Paid | Tax Assessment Tax Assessment Total Assessment is a certain percentage of the fair market value that is determined by local assessors to be the total taxable value of land and additions on the property. | Land | Improvement |
|---|---|---|---|---|
| 2024 | -- | $81,250 | $22,500 | $58,750 |
| 2023 | $2,132 | $81,250 | $22,500 | $58,750 |
| 2022 | $1,910 | $49,475 | $7,900 | $41,575 |
| 2021 | $1,910 | $49,475 | $7,900 | $41,575 |
| 2020 | $1,787 | $49,475 | $7,900 | $41,575 |
| 2019 | $1,787 | $49,475 | $7,900 | $41,575 |
| 2018 | $1,784 | $49,475 | $7,900 | $41,575 |
| 2017 | $1,686 | $39,050 | $6,325 | $32,725 |
| 2016 | $1,686 | $39,050 | $6,325 | $32,725 |
| 2015 | $1,637 | $39,050 | $6,325 | $32,725 |
| 2014 | $1,637 | $39,050 | $6,325 | $32,725 |
Source: Public Records
Map
Nearby Homes
- 313 Holly Ln
- 221 Foster Dr
- 7950 Bill Moss Rd
- 7728 Boyles Rd
- 1036 Stagecoach Dr
- 1032 Stagecoach Dr
- 3349 Granway Ln
- 5182 Owens Ln
- 7263 Golden Way
- 4100 Roane Dr
- 0 Bill Moss Rd
- 0 Wilkinson Dr Unit RTC2786582
- 2062 Seiver Ln
- 2032 Seiver Ln
- 2040 Seiver Ln
- 2024 Seiver Ln
- 2018 Seiver Ln
- 408 Wilkinson Ln
- PENWELL Plan at The Parks
- ARIA Plan at The Parks
- 111 Willowleaf Ln
- 105 Willowleaf Ln
- 229 Holly Ln
- 113 Willowleaf Ln
- 101 Willowleaf Ln
- 112 Willowleaf Ln
- 225 Holly Ln
- 305 Holly Ln
- 117 Willowleaf Ln
- 104 Willowleaf Ln
- 100 Sundance Way
- 221 Holly Ln
- 309 Holly Ln
- 101 Sundance Way
- 121 Willowleaf Ln
- 302 Holly Ln
- 120 Willowleaf Ln
- 224 Holly Ln
- 304 Holly Ln
- 104 Sundance Way