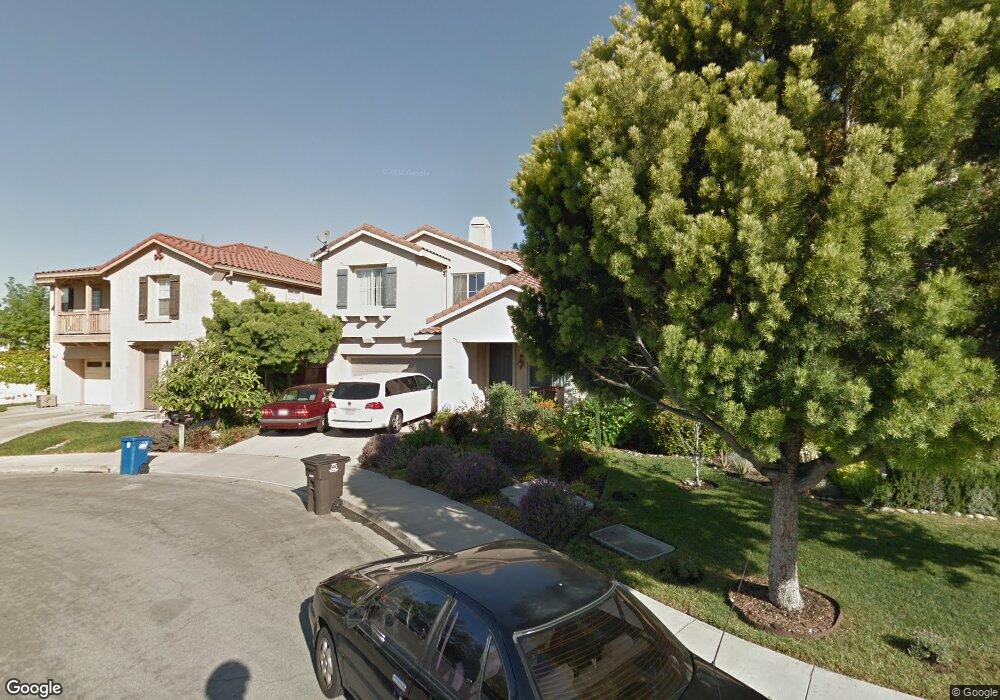
109 Windflower Ln Union City, CA 94587
Downtown Union City NeighborhoodEstimated Value: $1,390,264 - $1,632,000
3
Beds
3
Baths
1,772
Sq Ft
$884/Sq Ft
Est. Value
About This Home
This home is located at 109 Windflower Ln, Union City, CA 94587 and is currently estimated at $1,565,566, approximately $883 per square foot. 109 Windflower Ln is a home located in Alameda County with nearby schools including Guy Jr. Emanuele Elementary School, Cesar Chavez Middle School, and James Logan High School.
Ownership History
Date
Name
Owned For
Owner Type
Purchase Details
Closed on
Aug 31, 2018
Sold by
Mulcahy Lachlan
Bought by
Wang Xu and Hu Jia
Current Estimated Value
Home Financials for this Owner
Home Financials are based on the most recent Mortgage that was taken out on this home.
Original Mortgage
$750,000
Outstanding Balance
$645,446
Interest Rate
4%
Mortgage Type
Adjustable Rate Mortgage/ARM
Estimated Equity
$920,120
Purchase Details
Closed on
Sep 20, 2013
Sold by
Arthur Gary and Suen Carmen
Bought by
Mulcahy Lachlan
Home Financials for this Owner
Home Financials are based on the most recent Mortgage that was taken out on this home.
Original Mortgage
$513,750
Interest Rate
4.46%
Mortgage Type
New Conventional
Purchase Details
Closed on
Jan 15, 2009
Sold by
He Tao
Bought by
Arthur Gary and Suen Carmen
Home Financials for this Owner
Home Financials are based on the most recent Mortgage that was taken out on this home.
Original Mortgage
$521,061
Interest Rate
5.49%
Mortgage Type
FHA
Purchase Details
Closed on
Aug 8, 2006
Sold by
Merritt Dean L and Zhang Jun Ying
Bought by
He Tao
Home Financials for this Owner
Home Financials are based on the most recent Mortgage that was taken out on this home.
Original Mortgage
$612,000
Interest Rate
6.37%
Mortgage Type
Purchase Money Mortgage
Purchase Details
Closed on
Apr 6, 2006
Sold by
Merritt Dean L and Zhang Jun Ying
Bought by
Merritt Dean L and Zhang Jun Ying
Home Financials for this Owner
Home Financials are based on the most recent Mortgage that was taken out on this home.
Original Mortgage
$220,000
Interest Rate
6.2%
Mortgage Type
Credit Line Revolving
Purchase Details
Closed on
Oct 14, 2003
Sold by
Carr Sean T and Chan Michelle M
Bought by
Merritt Dean L and Zhang Jun Ying
Home Financials for this Owner
Home Financials are based on the most recent Mortgage that was taken out on this home.
Original Mortgage
$464,000
Interest Rate
5.25%
Mortgage Type
Purchase Money Mortgage
Purchase Details
Closed on
Mar 14, 2001
Sold by
Greystone Homes Inc
Bought by
Carr Sean T and Chan Michelle M
Home Financials for this Owner
Home Financials are based on the most recent Mortgage that was taken out on this home.
Original Mortgage
$447,800
Interest Rate
6.87%
Purchase Details
Closed on
Nov 27, 2000
Sold by
Len Ashford Iii Llc
Bought by
Greystone Homes Inc
Create a Home Valuation Report for This Property
The Home Valuation Report is an in-depth analysis detailing your home's value as well as a comparison with similar homes in the area
Home Values in the Area
Average Home Value in this Area
Purchase History
| Date | Buyer | Sale Price | Title Company |
|---|---|---|---|
| Wang Xu | $1,156,000 | First American Title Company | |
| Mulcahy Lachlan | $685,000 | Cornerstone Title Company | |
| Arthur Gary | $569,000 | Fidelity National Title Co | |
| He Tao | $765,000 | Fidelity National Title Co | |
| Merritt Dean L | -- | Alliance Title Company | |
| Merritt Dean L | $580,000 | Chicago Title Company | |
| Carr Sean T | $561,000 | North American Title Co | |
| Greystone Homes Inc | -- | North American Title |
Source: Public Records
Mortgage History
| Date | Status | Borrower | Loan Amount |
|---|---|---|---|
| Open | Wang Xu | $750,000 | |
| Previous Owner | Mulcahy Lachlan | $513,750 | |
| Previous Owner | Arthur Gary | $521,061 | |
| Previous Owner | He Tao | $612,000 | |
| Previous Owner | Merritt Dean L | $220,000 | |
| Previous Owner | Merritt Dean L | $464,000 | |
| Previous Owner | Carr Sean T | $447,800 | |
| Closed | Merritt Dean L | $58,000 |
Source: Public Records
Tax History Compared to Growth
Tax History
| Year | Tax Paid | Tax Assessment Tax Assessment Total Assessment is a certain percentage of the fair market value that is determined by local assessors to be the total taxable value of land and additions on the property. | Land | Improvement |
|---|---|---|---|---|
| 2025 | $17,778 | $1,289,517 | $386,855 | $902,662 |
| 2024 | $17,778 | $1,264,235 | $379,270 | $884,965 |
| 2023 | $17,288 | $1,239,451 | $371,835 | $867,616 |
| 2022 | $17,027 | $1,215,151 | $364,545 | $850,606 |
| 2021 | $16,652 | $1,191,327 | $357,398 | $833,929 |
| 2020 | $16,249 | $1,179,120 | $353,736 | $825,384 |
| 2019 | $16,417 | $1,156,000 | $346,800 | $809,200 |
| 2018 | $10,998 | $737,991 | $221,397 | $516,594 |
| 2017 | $10,739 | $723,524 | $217,057 | $506,467 |
| 2016 | $10,356 | $709,337 | $212,801 | $496,536 |
| 2015 | $10,162 | $698,685 | $209,605 | $489,080 |
| 2014 | $9,790 | $685,000 | $205,500 | $479,500 |
Source: Public Records
Map
Nearby Homes
- 126 Bellflower Ln
- 213 Ladera Plaza Unit 13
- 208 Appian Way
- 217 Appian Way
- 352 Monte Carlo Ave
- 1020 Carnelian Terrace
- 35005 11th St
- 34237 Torrey Pine Ln
- 35560 Monterra Terrace Unit 301
- 1157 Silver St
- 394 Appian Way
- 33852 11th St
- 315 Springstone Dr
- 33848 10th St
- 33718 3rd St
- 33840 10th St
- 33853 10th St
- 34926 Osprey Dr
- 902 G St
- 2224 Peacock Place Unit 3
- 107 Windflower Ln
- 111 Windflower Ln
- 105 Windflower Ln
- 103 Windflower Ln
- 106 Windflower Ln
- 114 Valley Oaks Loop
- 108 Windflower Ln
- 110 Windflower Ln
- 116 Valley Oaks Loop
- 104 Windflower Ln
- 112 Valley Oaks Loop
- 121 Elderberry Ln
- 101 Windflower Ln
- 110 Valley Oaks Loop
- 120 Elderberry Ln
- 34433 Torrey Pine Ln
- 34429 Torrey Pine Ln
- 125 Elderberry Ln
- 34501 Windflower Ln
- 107 Pear Ln