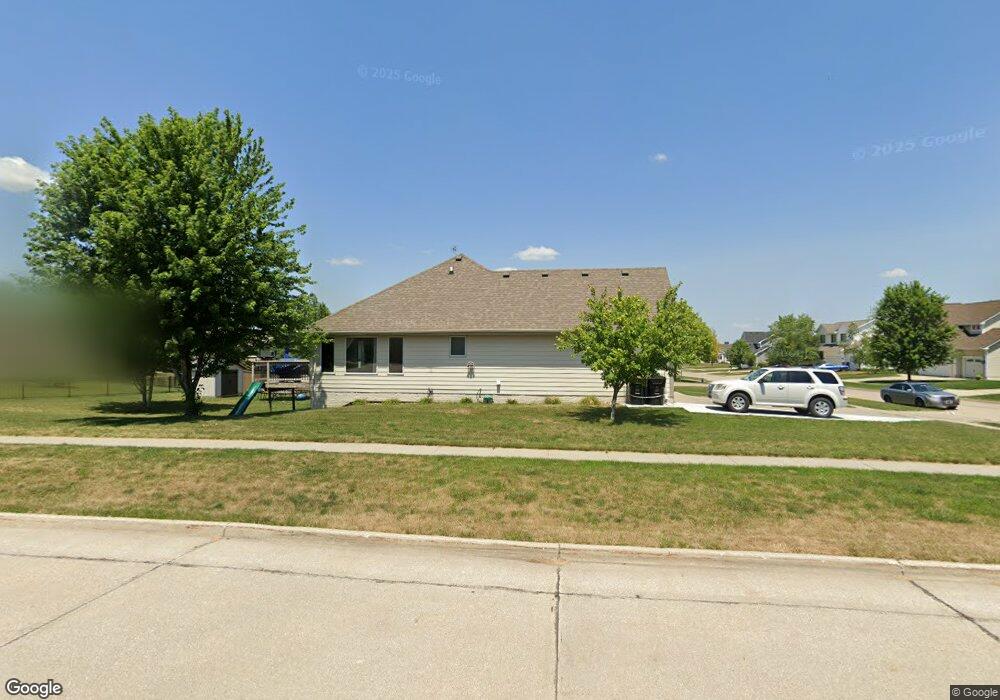
1090 SE Bluegrass Cir Waukee, IA 50263
Estimated Value: $370,475 - $412,000
3
Beds
3
Baths
1,693
Sq Ft
$228/Sq Ft
Est. Value
About This Home
This home is located at 1090 SE Bluegrass Cir, Waukee, IA 50263 and is currently estimated at $386,619, approximately $228 per square foot. 1090 SE Bluegrass Cir is a home located in Dallas County with nearby schools including Eason Elementary School, Prairieview Middle School, and South Middle School.
Ownership History
Date
Name
Owned For
Owner Type
Purchase Details
Closed on
Jun 6, 2016
Sold by
Andrew Carrie
Bought by
Peterson Mark
Current Estimated Value
Home Financials for this Owner
Home Financials are based on the most recent Mortgage that was taken out on this home.
Original Mortgage
$196,000
Outstanding Balance
$156,450
Interest Rate
3.66%
Mortgage Type
New Conventional
Estimated Equity
$230,169
Purchase Details
Closed on
Dec 28, 2009
Sold by
Savage Donald R and Savage Mary K
Bought by
Andrew Carrie
Purchase Details
Closed on
Mar 30, 2006
Sold by
Adams Custom Homes Inc
Bought by
Savage Donald R and Savage Mary K
Home Financials for this Owner
Home Financials are based on the most recent Mortgage that was taken out on this home.
Original Mortgage
$191,900
Interest Rate
6.38%
Mortgage Type
New Conventional
Create a Home Valuation Report for This Property
The Home Valuation Report is an in-depth analysis detailing your home's value as well as a comparison with similar homes in the area
Home Values in the Area
Average Home Value in this Area
Purchase History
| Date | Buyer | Sale Price | Title Company |
|---|---|---|---|
| Peterson Mark | $245,000 | None Available | |
| Peterson Mark | $245,000 | None Available | |
| Andrew Carrie | $240,000 | None Available | |
| Savage Donald R | $240,000 | None Available |
Source: Public Records
Mortgage History
| Date | Status | Borrower | Loan Amount |
|---|---|---|---|
| Open | Peterson Mark | $196,000 | |
| Closed | Peterson Mark | $196,000 | |
| Previous Owner | Savage Donald R | $191,900 |
Source: Public Records
Tax History Compared to Growth
Tax History
| Year | Tax Paid | Tax Assessment Tax Assessment Total Assessment is a certain percentage of the fair market value that is determined by local assessors to be the total taxable value of land and additions on the property. | Land | Improvement |
|---|---|---|---|---|
| 2024 | $5,776 | $348,800 | $60,000 | $288,800 |
| 2023 | $5,776 | $348,800 | $60,000 | $288,800 |
| 2022 | $5,240 | $306,090 | $60,000 | $246,090 |
| 2021 | $5,240 | $281,550 | $60,000 | $221,550 |
| 2020 | $5,166 | $267,920 | $60,000 | $207,920 |
| 2019 | $5,272 | $267,920 | $60,000 | $207,920 |
| 2018 | $5,272 | $260,050 | $60,000 | $200,050 |
| 2017 | $5,180 | $260,050 | $60,000 | $200,050 |
| 2016 | $5,120 | $255,600 | $55,000 | $200,600 |
| 2015 | $4,974 | $250,010 | $0 | $0 |
| 2014 | $4,640 | $239,750 | $0 | $0 |
Source: Public Records
Map
Nearby Homes
- 1307 SE University Ave Unit 205
- 1406 SE Williams Ct
- 1313 SE University Ave Unit 206
- 1313 SE University Ave Unit 202
- 1333 SE University Ave Unit 303
- 1309 SE University Ave Unit 203
- 1015 SE Applewood Ln
- 727 SE Williams Ct
- 692 SE Williams Ct
- 1155 SE Grant Woods Ct
- 1440 SE Sagewood Cir
- 9674 Crowning Dr
- 9664 Starview Dr
- 9683 Crestview Dr
- 1815 SE Hickory Cir
- 9680 Crestview Dr
- 9574 Crowning Dr
- 1825 SE Hickory Cir
- 00 Calvin Dr
- 9563 Crestview Dr
- 1100 SE Bluegrass Cir
- 995 SE Bluegrass Cir
- 1110 SE Bluegrass Cir
- 1060 SE Bluegrass Cir
- 1050 SE Bluegrass Cir
- 1095 SE Bluegrass Cir
- 1105 SE Bluegrass Cir
- 1040 SE Bluegrass Cir
- 975 SE Bluegrass Cir
- 1070 SE Bluegrass Cir
- 1120 SE Bluegrass Cir
- 1085 SE Bluegrass Cir
- 1115 SE Bluegrass Cir
- 1030 SE Bluegrass Cir
- 1075 SE Bluegrass Cir
- 965 SE Bluegrass Cir
- 1125 SE Bluegrass Cir
- 1130 SE Bluegrass Cir
- 1030 SE Waco Place