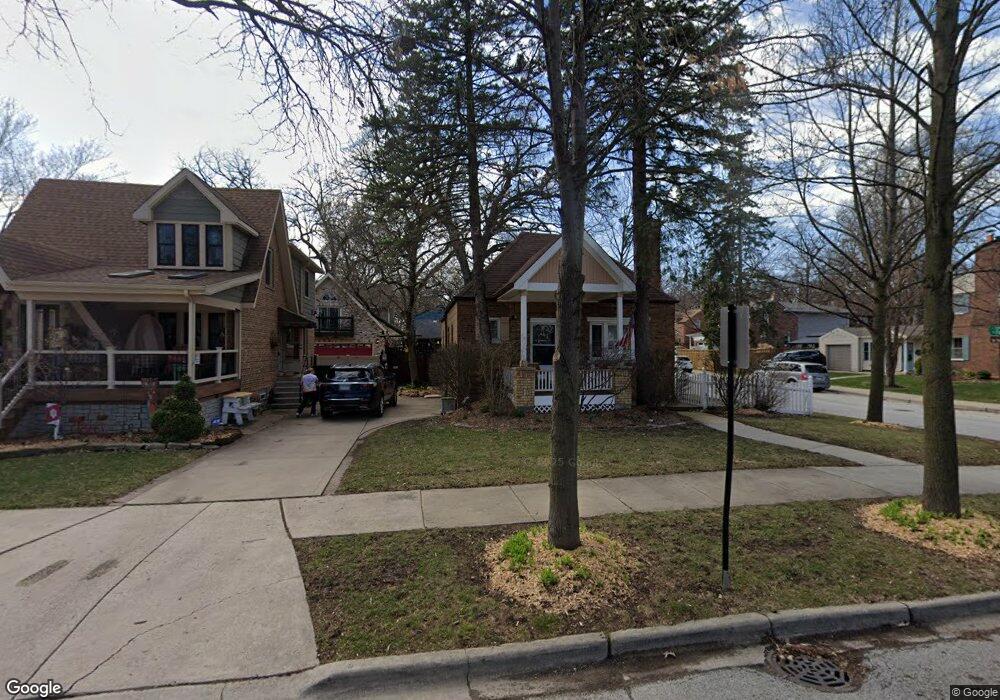
10900 S Fairfield Ave Chicago, IL 60655
Morgan Park NeighborhoodEstimated Value: $349,000 - $408,000
3
Beds
2
Baths
1,593
Sq Ft
$236/Sq Ft
Est. Value
About This Home
This home is located at 10900 S Fairfield Ave, Chicago, IL 60655 and is currently estimated at $375,960, approximately $236 per square foot. 10900 S Fairfield Ave is a home located in Cook County with nearby schools including Clissold Elementary School, Morgan Park High School, and St Cajetan Elementary School.
Ownership History
Date
Name
Owned For
Owner Type
Purchase Details
Closed on
Sep 17, 2012
Sold by
Dorsch Michael D and Dorsch Susan M
Bought by
Msdl Realty Llc
Current Estimated Value
Purchase Details
Closed on
Sep 17, 2007
Sold by
Hoylman Schwab Lynn and Hoylman Charles
Bought by
Dorsch Michael D and Dorsch Susan M
Purchase Details
Closed on
Jul 5, 2005
Sold by
Founders Bank
Bought by
Hoylman Schwab Lynn and Hoylman Charles
Home Financials for this Owner
Home Financials are based on the most recent Mortgage that was taken out on this home.
Original Mortgage
$91,500
Interest Rate
5.82%
Mortgage Type
Balloon
Purchase Details
Closed on
Jul 22, 1994
Sold by
Hoylman Gladys J
Bought by
Mount Greenwood Bank
Purchase Details
Closed on
Feb 22, 1994
Sold by
Hoylman Robert E
Bought by
Hoylman Gladys
Create a Home Valuation Report for This Property
The Home Valuation Report is an in-depth analysis detailing your home's value as well as a comparison with similar homes in the area
Home Values in the Area
Average Home Value in this Area
Purchase History
| Date | Buyer | Sale Price | Title Company |
|---|---|---|---|
| Msdl Realty Llc | -- | None Available | |
| Dorsch Michael D | $250,000 | Pntn | |
| Hoylman Schwab Lynn | -- | Stewart Title | |
| Mount Greenwood Bank | -- | -- | |
| Hoylman Gladys | -- | -- |
Source: Public Records
Mortgage History
| Date | Status | Borrower | Loan Amount |
|---|---|---|---|
| Previous Owner | Hoylman Schwab Lynn | $91,500 |
Source: Public Records
Tax History Compared to Growth
Tax History
| Year | Tax Paid | Tax Assessment Tax Assessment Total Assessment is a certain percentage of the fair market value that is determined by local assessors to be the total taxable value of land and additions on the property. | Land | Improvement |
|---|---|---|---|---|
| 2024 | $4,376 | $31,999 | $6,750 | $25,249 |
| 2023 | $4,247 | $24,006 | $5,400 | $18,606 |
| 2022 | $4,247 | $24,006 | $5,400 | $18,606 |
| 2021 | $4,169 | $24,006 | $5,400 | $18,606 |
| 2020 | $4,718 | $24,230 | $5,130 | $19,100 |
| 2019 | $4,673 | $26,627 | $5,130 | $21,497 |
| 2018 | $4,593 | $26,627 | $5,130 | $21,497 |
| 2017 | $4,484 | $24,160 | $4,590 | $19,570 |
| 2016 | $4,349 | $24,160 | $4,590 | $19,570 |
| 2015 | $3,956 | $24,160 | $4,590 | $19,570 |
| 2014 | $3,768 | $22,826 | $4,320 | $18,506 |
| 2013 | $3,682 | $22,826 | $4,320 | $18,506 |
Source: Public Records
Map
Nearby Homes
- 10741 S California Ave
- 10735 S Washtenaw Ave
- 2518 W 109th Place
- 11125 S Fairfield Ave
- 2519 W 110th St
- 10829 S Maplewood Ave
- 11017 S Campbell Ave
- 2550 W 112th St Unit 12L
- 2550 W 112th St Unit 15-O
- 11224 S Fairfield Ave
- 10726 S Sacramento Ave
- 11255 S Fairfield Ave
- 11138 S Artesian Ave
- 2336 W 111th St Unit 2
- 11130 S Whipple St
- 2348 W 111th St Unit 3
- 11214 S Sacramento Ave
- 11237 S Albany Ave
- 10643 S Troy St
- 11418 S Washtenaw Ave
- 10904 S Fairfield Ave
- 10910 S Fairfield Ave
- 10858 S Fairfield Ave
- 10914 S Fairfield Ave
- 10901 S California Ave
- 10905 S California Ave
- 10852 S Fairfield Ave
- 10909 S California Ave
- 10918 S Fairfield Ave
- 2748 W 109th St
- 10913 S California Ave
- 10901 S Fairfield Ave
- 10848 S Fairfield Ave
- 10922 S Fairfield Ave
- 10907 S Fairfield Ave
- 10917 S California Ave
- 10931 S California Ave
- 10911 S Fairfield Ave
- 10859 S Fairfield Ave
- 2758 W 109th St