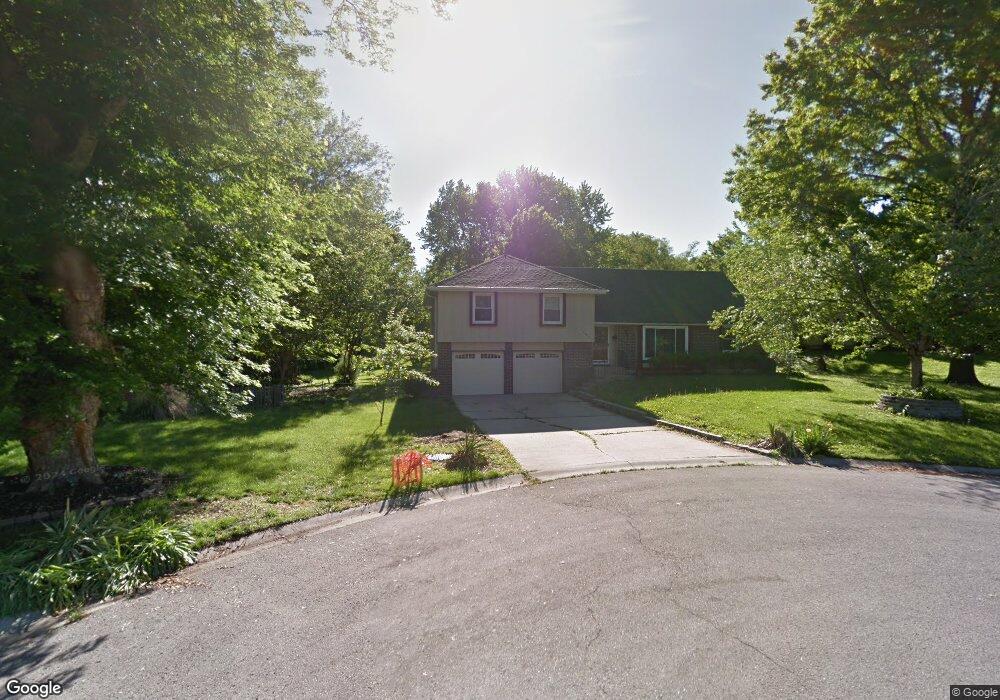
10903 W 73rd St Shawnee, KS 66203
Estimated Value: $345,000 - $375,132
4
Beds
2
Baths
1,595
Sq Ft
$224/Sq Ft
Est. Value
About This Home
This home is located at 10903 W 73rd St, Shawnee, KS 66203 and is currently estimated at $357,033, approximately $223 per square foot. 10903 W 73rd St is a home located in Johnson County with nearby schools including Nieman Elementary School, Hocker Grove Middle School, and Shawnee Mission North High School.
Ownership History
Date
Name
Owned For
Owner Type
Purchase Details
Closed on
Nov 16, 2020
Sold by
Grunza Theodore and Grunza Anna
Bought by
Grunza Theodore and Grunza Anna
Current Estimated Value
Home Financials for this Owner
Home Financials are based on the most recent Mortgage that was taken out on this home.
Original Mortgage
$141,800
Outstanding Balance
$100,588
Interest Rate
2.3%
Mortgage Type
New Conventional
Estimated Equity
$256,445
Purchase Details
Closed on
Nov 1, 2008
Sold by
Archway Homes Inc
Bought by
Grunza Ii Theodeore and Grunza Anna
Home Financials for this Owner
Home Financials are based on the most recent Mortgage that was taken out on this home.
Original Mortgage
$169,083
Interest Rate
5.98%
Mortgage Type
FHA
Create a Home Valuation Report for This Property
The Home Valuation Report is an in-depth analysis detailing your home's value as well as a comparison with similar homes in the area
Home Values in the Area
Average Home Value in this Area
Purchase History
| Date | Buyer | Sale Price | Title Company |
|---|---|---|---|
| Grunza Theodore | -- | Stewart Title Company | |
| Grunza Theodore | -- | Stewart Title | |
| Grunza Ii Theodeore | -- | First American Title Insuran |
Source: Public Records
Mortgage History
| Date | Status | Borrower | Loan Amount |
|---|---|---|---|
| Open | Grunza Theodore | $141,800 | |
| Closed | Grunza Theodore | $141,800 | |
| Previous Owner | Grunza Ii Theodeore | $169,083 |
Source: Public Records
Tax History Compared to Growth
Tax History
| Year | Tax Paid | Tax Assessment Tax Assessment Total Assessment is a certain percentage of the fair market value that is determined by local assessors to be the total taxable value of land and additions on the property. | Land | Improvement |
|---|---|---|---|---|
| 2024 | $4,024 | $38,076 | $7,752 | $30,324 |
| 2023 | $3,768 | $35,167 | $7,752 | $27,415 |
| 2022 | $3,578 | $33,269 | $6,747 | $26,522 |
| 2021 | $3,291 | $28,681 | $5,865 | $22,816 |
| 2020 | $3,042 | $26,151 | $5,335 | $20,816 |
| 2019 | $2,923 | $25,104 | $4,639 | $20,465 |
| 2018 | $2,723 | $23,287 | $4,226 | $19,061 |
| 2017 | $2,722 | $22,919 | $4,226 | $18,693 |
| 2016 | $2,507 | $20,826 | $4,226 | $16,600 |
| 2015 | $2,365 | $20,447 | $4,226 | $16,221 |
| 2013 | -- | $19,538 | $4,226 | $15,312 |
Source: Public Records
Map
Nearby Homes
- 7219 Reeder St
- 7226 Edgewood Blvd
- 10902 W 71st Place
- 7410 Stearns St
- 7425 Melrose Ln
- 10314 W 73rd St
- 10914 W 71st St
- 10406 W 71st Place
- 10236 Edelweiss Cir
- 11406 W 71st St
- 10152 Edelweiss Cir
- 7240 Mastin St
- 11217 W 69th Terrace
- 10024 W 70th Terrace
- 9906 Edelweiss Cir
- 10235 W 70th St
- 7107 Garnett St
- 11324 W 77th Terrace
- 10924 W 67th St
- 11637 W 68th Terrace
- 10904 W 73rd St
- 7322 Goddard Dr
- 7318 Goddard Dr
- 7326 Goddard Dr
- 7314 Goddard Dr
- 10811 W 72nd Terrace
- 10909 W 73rd St
- 10901 W 72nd Terrace
- 10807 W 72nd Terrace
- 10908 W 73rd St
- 10905 W 72nd Terrace
- 7330 Goddard Dr
- 10911 W 73rd St
- 10803 W 72nd Terrace
- 10909 W 72nd Terrace
- 10912 W 73rd St
- 7334 Goddard Dr
- 7321 Goddard Dr
- 7317 Goddard Dr
- 10911 W 72nd Terrace