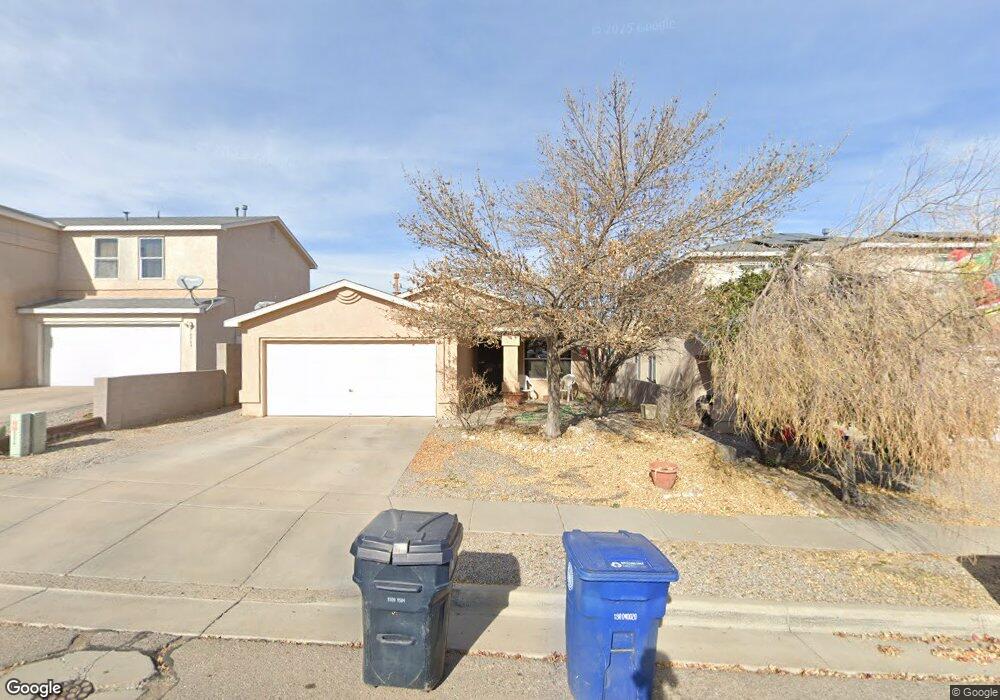
10905 Red Robin Rd SW Albuquerque, NM 87121
Southwest Heights NeighborhoodEstimated Value: $279,786 - $294,000
3
Beds
2
Baths
1,606
Sq Ft
$178/Sq Ft
Est. Value
About This Home
This home is located at 10905 Red Robin Rd SW, Albuquerque, NM 87121 and is currently estimated at $285,447, approximately $177 per square foot. 10905 Red Robin Rd SW is a home located in Bernalillo County with nearby schools including Carlos Rey Elementary School, Tony Hillerman Middle School, and Atrisco Heritage Academy High School.
Ownership History
Date
Name
Owned For
Owner Type
Purchase Details
Closed on
Sep 1, 2022
Sold by
Gurule Carlos R
Bought by
Gurule Carlos R and Gurule Michael
Current Estimated Value
Home Financials for this Owner
Home Financials are based on the most recent Mortgage that was taken out on this home.
Original Mortgage
$124,000
Outstanding Balance
$112,658
Interest Rate
5.3%
Mortgage Type
VA
Estimated Equity
$172,789
Purchase Details
Closed on
Dec 4, 2009
Sold by
Gurule Carlos R
Bought by
Gurule Carlos R and Gurule Michael R
Home Financials for this Owner
Home Financials are based on the most recent Mortgage that was taken out on this home.
Original Mortgage
$125,031
Interest Rate
5.06%
Mortgage Type
VA
Purchase Details
Closed on
Jun 14, 2002
Sold by
Centex Homes
Bought by
Gurule Carlos R
Home Financials for this Owner
Home Financials are based on the most recent Mortgage that was taken out on this home.
Original Mortgage
$111,751
Interest Rate
6.77%
Mortgage Type
FHA
Create a Home Valuation Report for This Property
The Home Valuation Report is an in-depth analysis detailing your home's value as well as a comparison with similar homes in the area
Home Values in the Area
Average Home Value in this Area
Purchase History
| Date | Buyer | Sale Price | Title Company |
|---|---|---|---|
| Gurule Carlos R | -- | Vantage Point Title | |
| Gurule Carlos R | -- | Accommodation | |
| Gurule Carlos R | -- | -- |
Source: Public Records
Mortgage History
| Date | Status | Borrower | Loan Amount |
|---|---|---|---|
| Open | Gurule Carlos R | $124,000 | |
| Previous Owner | Gurule Carlos R | $125,031 | |
| Previous Owner | Gurule Carlos R | $111,751 | |
| Closed | Gurule Carlos R | $4,000 |
Source: Public Records
Tax History Compared to Growth
Tax History
| Year | Tax Paid | Tax Assessment Tax Assessment Total Assessment is a certain percentage of the fair market value that is determined by local assessors to be the total taxable value of land and additions on the property. | Land | Improvement |
|---|---|---|---|---|
| 2024 | -- | $45,094 | $13,828 | $31,266 |
| 2023 | $0 | $43,781 | $13,425 | $30,356 |
| 2022 | $0 | $42,506 | $13,034 | $29,472 |
| 2021 | $0 | $41,268 | $12,655 | $28,613 |
| 2020 | $0 | $40,066 | $12,286 | $27,780 |
| 2019 | $0 | $38,900 | $11,929 | $26,971 |
| 2018 | $0 | $38,900 | $11,929 | $26,971 |
| 2017 | $0 | $37,768 | $11,582 | $26,186 |
| 2016 | $0 | $35,600 | $10,917 | $24,683 |
| 2015 | $34,563 | $34,563 | $10,599 | $23,964 |
| 2014 | -- | $34,563 | $10,599 | $23,964 |
| 2013 | -- | $34,830 | $10,599 | $24,231 |
Source: Public Records
Map
Nearby Homes
- 11001 Paso Fino Ave SW
- 11004 Teal Rd SW
- 919 Crane Dr SW
- 11015 Connemara Dr SW
- 1111 Carla St SW
- 10504 Connemara Dr SW
- 10409 Red Robin Rd SW
- 10316 Andalusian Ave SW
- 10312 Cornelia Ct SW
- 1309 Canyon Trail SW
- 805 Malachite Dr SW
- 10350 Sunset Gardens Rd SW
- 632 Foyt Dr SW
- 1401 Elfego Baca Dr SW
- 10622 Benavides Rd SW
- 10709 Anaya St SW
- 1520 Elfego Baca Dr SW Unit 2
- 9736 Westbound Ave SW
- 9900 Ladder Ranch Ln SW
- 9931 Hideout Ln SW
- 10901 Red Robin Rd SW
- 10909 Red Robin Rd SW
- 10915 Red Robin Rd SW
- 10819 Red Robin Rd SW
- 11000 Andalusian Ave SW
- 10815 Red Robin Rd SW
- 11001 Red Robin Rd SW
- 10808 Andalusian Ave SW
- 905 Hawk Dr SW
- 11004 Andalusian Ave SW
- 10804 Andalusian Ave SW
- 10809 Red Robin Rd SW Unit 3
- 11005 Red Robin Rd SW
- 11008 Andalusian Ave SW
- 10800 Andalusian Ave SW
- 909 Hawk Dr SW
- 10805 Red Robin Rd SW
- 908 Hawk Dr SW
- 904 Wood Duck Dr SW
- 11009 Red Robin Rd SW