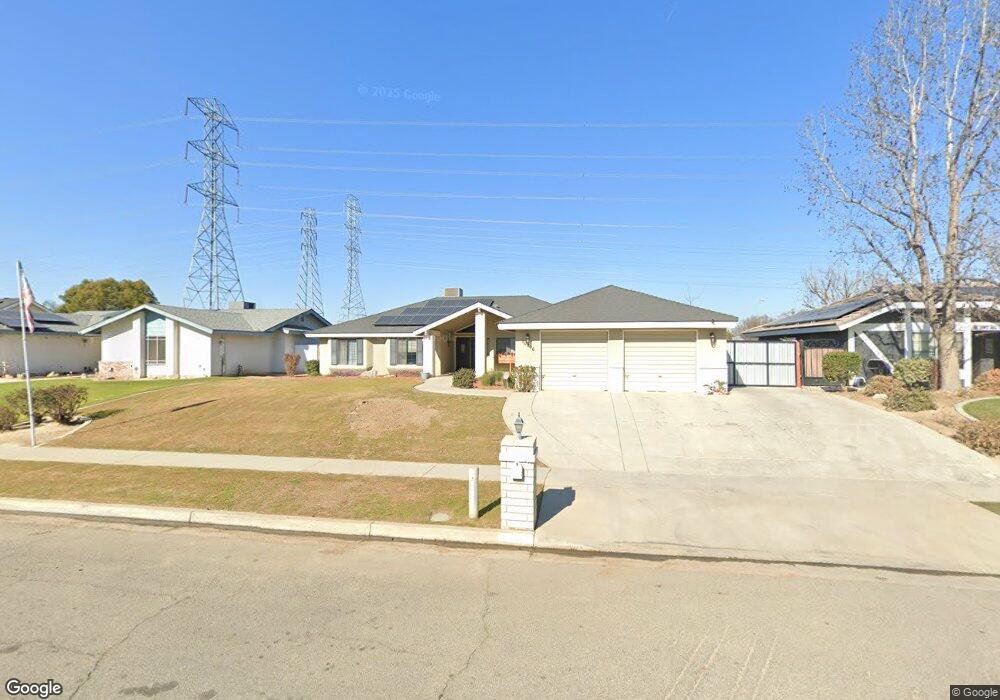
10906 Dee Dee Ave Bakersfield, CA 93312
Polo Grounds NeighborhoodEstimated Value: $446,000 - $508,000
3
Beds
2
Baths
1,850
Sq Ft
$261/Sq Ft
Est. Value
About This Home
This home is located at 10906 Dee Dee Ave, Bakersfield, CA 93312 and is currently estimated at $482,846, approximately $260 per square foot. 10906 Dee Dee Ave is a home located in Kern County with nearby schools including Rosedale-North Elementary School, Freedom Middle School, and Centennial High School.
Ownership History
Date
Name
Owned For
Owner Type
Purchase Details
Closed on
Mar 25, 2021
Sold by
Mealer Daryl and Mealer Kristin
Bought by
Mealer Daryl J and Mealer Kristin A
Current Estimated Value
Purchase Details
Closed on
Jun 13, 2017
Sold by
Seymour Carla R
Bought by
Mealer Daryl and Mealer Kristin
Home Financials for this Owner
Home Financials are based on the most recent Mortgage that was taken out on this home.
Original Mortgage
$270,019
Outstanding Balance
$223,671
Interest Rate
3.87%
Mortgage Type
FHA
Estimated Equity
$259,175
Purchase Details
Closed on
Dec 16, 2016
Sold by
Seymour Bradley J
Bought by
Seymour Carla R
Purchase Details
Closed on
Jul 6, 2011
Sold by
Collet Marlane Tomin
Bought by
Seymour Bradley J and Seymour Carla R
Home Financials for this Owner
Home Financials are based on the most recent Mortgage that was taken out on this home.
Original Mortgage
$200,000
Interest Rate
4.45%
Mortgage Type
Purchase Money Mortgage
Create a Home Valuation Report for This Property
The Home Valuation Report is an in-depth analysis detailing your home's value as well as a comparison with similar homes in the area
Home Values in the Area
Average Home Value in this Area
Purchase History
| Date | Buyer | Sale Price | Title Company |
|---|---|---|---|
| Mealer Daryl J | -- | None Available | |
| Mealer Daryl | $275,000 | Placer Title Company | |
| Seymour Carla R | -- | None Available | |
| Seymour Bradley J | $210,000 | Ticor Title Company Of Ca |
Source: Public Records
Mortgage History
| Date | Status | Borrower | Loan Amount |
|---|---|---|---|
| Open | Mealer Daryl | $270,019 | |
| Previous Owner | Seymour Bradley J | $200,000 |
Source: Public Records
Tax History
| Year | Tax Paid | Tax Assessment Tax Assessment Total Assessment is a certain percentage of the fair market value that is determined by local assessors to be the total taxable value of land and additions on the property. | Land | Improvement |
|---|---|---|---|---|
| 2025 | $4,094 | $319,155 | $81,238 | $237,917 |
| 2024 | $4,003 | $312,898 | $79,646 | $233,252 |
| 2023 | $4,003 | $306,764 | $78,085 | $228,679 |
| 2022 | $3,906 | $300,750 | $76,554 | $224,196 |
| 2021 | $3,785 | $294,853 | $75,053 | $219,800 |
| 2020 | $3,715 | $291,831 | $74,284 | $217,547 |
| 2019 | $3,740 | $291,831 | $74,284 | $217,547 |
| 2018 | $3,622 | $280,500 | $71,400 | $209,100 |
| 2017 | $2,746 | $210,175 | $48,496 | $161,679 |
| 2016 | $2,558 | $206,055 | $47,546 | $158,509 |
| 2015 | $2,528 | $202,961 | $46,832 | $156,129 |
| 2014 | $2,470 | $198,986 | $45,915 | $153,071 |
Source: Public Records
Map
Nearby Homes
- 11001 Aimee Way
- 10801 Baron Ave
- 3301 Beyers St
- 11216 Aimee Way
- 10617 Baron Ave
- 10512 Dee Ave
- 3435 Moss St
- 11409 Lariat Ct
- 3212 Chuckwagon St
- 0 Fruitvale Snow Rd Unit 202602724
- 11308 Sagebrush Ave
- 3105 Silver Spur Way
- 3122 Campfire Dr Unit 2
- 3110 Campfire Dr
- 3100 Woodstown St
- 10219 Planebrook Ave
- 3604 Mehgan Ave
- 2125 Verdugo Ln
- 10200 Wayland Ct
- 10409 Lonon Ave
- 10906 Dee Ave
- 10912 Dee Dee Ave
- 10900 Dee Ave
- 10900 Dee Dee Ave
- 10918 Dee Dee Ave
- 10918 Dee Ave
- 10907 Dee Ave
- 10907 Dee Dee Ave
- 10818 Dee Dee Ave
- 10901 Dee Ave
- 10913 Dee Dee Ave
- 10818 Dee Ave
- 10812 Dee Dee Ave
- 10819 Dee Dee Ave
- 10901 Dee Dee Ave
- 10924 Dee Dee Ave
- 2809 Nicole Way
- 10806 Dee Dee Ave
- 10905 Baron Ave
Your Personal Tour Guide
Ask me questions while you tour the home.