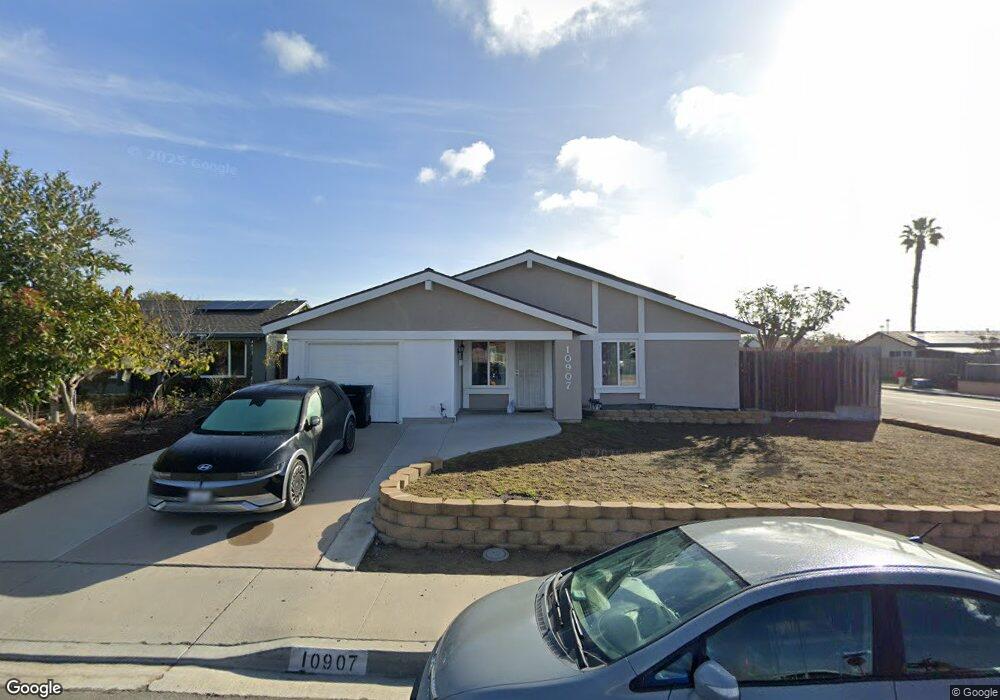
10907 New Salem Cir San Diego, CA 92126
Mira Mesa NeighborhoodEstimated Value: $1,047,054 - $1,221,000
3
Beds
2
Baths
1,656
Sq Ft
$675/Sq Ft
Est. Value
About This Home
This home is located at 10907 New Salem Cir, San Diego, CA 92126 and is currently estimated at $1,118,264, approximately $675 per square foot. 10907 New Salem Cir is a home located in San Diego County with nearby schools including Hickman Elementary School, Challenger Middle School, and Mira Mesa High School.
Ownership History
Date
Name
Owned For
Owner Type
Purchase Details
Closed on
Jun 30, 2010
Sold by
Sd Seaport Lp
Bought by
Naberhuis Brian and Smith Kathryn
Current Estimated Value
Home Financials for this Owner
Home Financials are based on the most recent Mortgage that was taken out on this home.
Original Mortgage
$311,200
Outstanding Balance
$206,071
Interest Rate
4.65%
Mortgage Type
New Conventional
Estimated Equity
$912,193
Purchase Details
Closed on
Jul 28, 2009
Sold by
Pereira Frederick and Pereira Ann
Bought by
Sd Seaport Lp
Purchase Details
Closed on
Jun 26, 1998
Sold by
Fazli Fakhradin and Fazli Manijeh
Bought by
Pereira Frederick and Pereira Ann
Home Financials for this Owner
Home Financials are based on the most recent Mortgage that was taken out on this home.
Original Mortgage
$183,498
Interest Rate
6.93%
Mortgage Type
VA
Purchase Details
Closed on
Apr 30, 1998
Sold by
Aminpour Nader A and Aminpour Mitra F
Bought by
Fazli Fakhradin and Fazli Manijeh
Home Financials for this Owner
Home Financials are based on the most recent Mortgage that was taken out on this home.
Original Mortgage
$183,498
Interest Rate
6.93%
Mortgage Type
VA
Purchase Details
Closed on
Sep 29, 1989
Purchase Details
Closed on
Jun 1, 1984
Create a Home Valuation Report for This Property
The Home Valuation Report is an in-depth analysis detailing your home's value as well as a comparison with similar homes in the area
Home Values in the Area
Average Home Value in this Area
Purchase History
| Date | Buyer | Sale Price | Title Company |
|---|---|---|---|
| Naberhuis Brian | $389,000 | Chicago Title Company | |
| Sd Seaport Lp | $292,000 | Chicago Title Company | |
| Pereira Frederick | $180,000 | Guardian Title Company | |
| Fazli Fakhradin | $139,653 | American Title Ins Co | |
| -- | $170,000 | -- | |
| -- | $105,900 | -- |
Source: Public Records
Mortgage History
| Date | Status | Borrower | Loan Amount |
|---|---|---|---|
| Open | Naberhuis Brian | $311,200 | |
| Previous Owner | Pereira Frederick | $183,498 |
Source: Public Records
Tax History Compared to Growth
Tax History
| Year | Tax Paid | Tax Assessment Tax Assessment Total Assessment is a certain percentage of the fair market value that is determined by local assessors to be the total taxable value of land and additions on the property. | Land | Improvement |
|---|---|---|---|---|
| 2025 | $5,967 | $498,365 | $365,471 | $132,894 |
| 2024 | $5,967 | $488,594 | $358,305 | $130,289 |
| 2023 | $5,833 | $479,015 | $351,280 | $127,735 |
| 2022 | $5,676 | $469,624 | $344,393 | $125,231 |
| 2021 | $5,635 | $460,417 | $337,641 | $122,776 |
| 2020 | $5,566 | $455,697 | $334,179 | $121,518 |
| 2019 | $5,464 | $446,763 | $327,627 | $119,136 |
| 2018 | $5,109 | $438,003 | $321,203 | $116,800 |
| 2017 | $80 | $429,415 | $314,905 | $114,510 |
| 2016 | $4,901 | $420,996 | $308,731 | $112,265 |
| 2015 | $4,828 | $414,673 | $304,094 | $110,579 |
| 2014 | $4,751 | $406,551 | $298,138 | $108,413 |
Source: Public Records
Map
Nearby Homes
- 7736 Alcamo Rd
- 7561 Windsong Rd
- 8007 New Salem St
- 10840 New Salem Point
- 7387 New Salem St
- 10692 Dabney Dr Unit 102
- 10668 Dabney Dr Unit 122
- 10668 Dabney Dr Unit 125
- 10840 Deering St
- 7684 Adkins Way
- 10948 Worthing Ave
- 7944 Calico St
- 10774 Dabney Dr Unit 20
- 11149 Blythe Rd
- 10785 Chinon Cir
- 10606 Aderman Ave Unit 5
- 10646 Aderman Ave Unit 21
- 10855 Camino Ruiz Unit 48
- 10875 Camino Ruiz Unit 50
- 10740 Aderman Ave Unit 66
- 10913 New Salem Cir
- 10906 Whitehall Cir
- 10912 Whitehall Cir
- 10897 New Salem Place
- 10919 New Salem Cir
- 10918 Whitehall Cir
- 10896 Whitehall Rd
- 10908 New Salem Cir
- 10914 New Salem Cir
- 10891 New Salem Place
- 7741 New Salem St
- 10888 Whitehall Rd
- 10925 New Salem Cir
- 10920 New Salem Cir
- 7731 New Salem St
- 10885 New Salem Place
- 10931 New Salem Cir
- 10907 Whitehall Cir
- 10882 Whitehall Rd
- 10913 Whitehall Cir