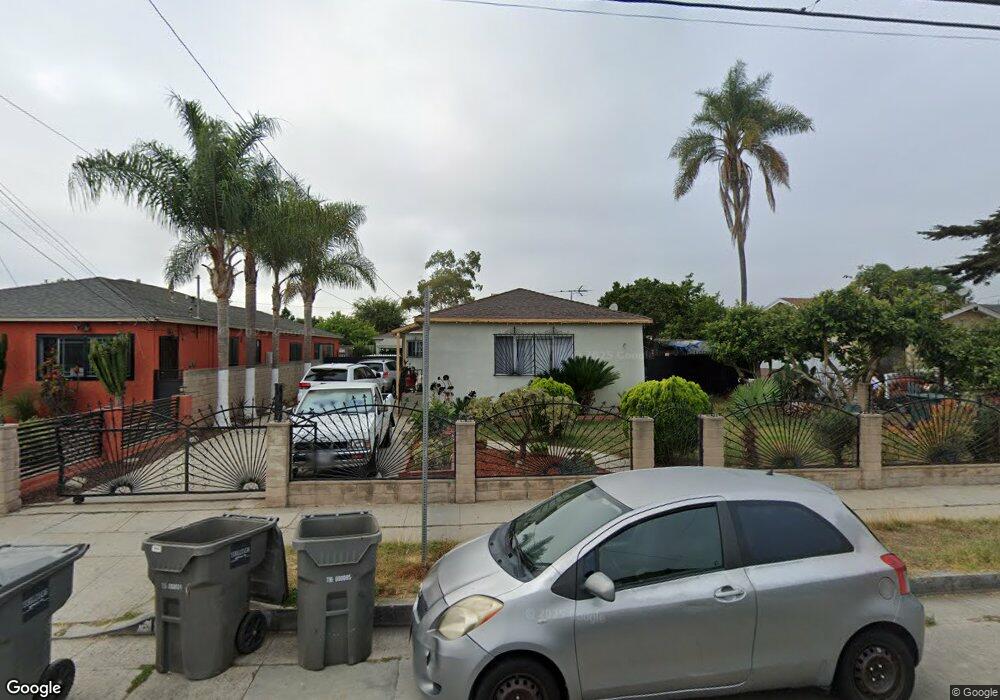
10907 S Grevillea Ave Inglewood, CA 90304
Lennox NeighborhoodEstimated Value: $874,000 - $954,000
--
Bed
--
Bath
2,067
Sq Ft
$439/Sq Ft
Est. Value
About This Home
This home is located at 10907 S Grevillea Ave, Inglewood, CA 90304 and is currently estimated at $906,598, approximately $438 per square foot. 10907 S Grevillea Ave is a home located in Los Angeles County with nearby schools including Jefferson Elementary School, Lennox Middle School, and Hawthorne High School.
Ownership History
Date
Name
Owned For
Owner Type
Purchase Details
Closed on
Jan 9, 2013
Sold by
Rios Maria O
Bought by
Barba Anabel and Rios Mercedes
Current Estimated Value
Purchase Details
Closed on
Jun 10, 2005
Sold by
Rios Maria Olga and Rios George
Bought by
Rios Maria O
Home Financials for this Owner
Home Financials are based on the most recent Mortgage that was taken out on this home.
Original Mortgage
$109,000
Outstanding Balance
$56,758
Interest Rate
5.72%
Mortgage Type
New Conventional
Estimated Equity
$849,840
Purchase Details
Closed on
Jan 24, 1994
Sold by
Rios Maria Olga
Bought by
Rios Maria Olga and Rios George
Home Financials for this Owner
Home Financials are based on the most recent Mortgage that was taken out on this home.
Original Mortgage
$95,000
Interest Rate
7.19%
Create a Home Valuation Report for This Property
The Home Valuation Report is an in-depth analysis detailing your home's value as well as a comparison with similar homes in the area
Home Values in the Area
Average Home Value in this Area
Purchase History
| Date | Buyer | Sale Price | Title Company |
|---|---|---|---|
| Barba Anabel | -- | None Available | |
| Rios Maria O | -- | United Title Company | |
| Rios Maria Olga | -- | Southern California Title Co |
Source: Public Records
Mortgage History
| Date | Status | Borrower | Loan Amount |
|---|---|---|---|
| Open | Rios Maria O | $109,000 | |
| Closed | Rios Maria Olga | $95,000 |
Source: Public Records
Tax History Compared to Growth
Tax History
| Year | Tax Paid | Tax Assessment Tax Assessment Total Assessment is a certain percentage of the fair market value that is determined by local assessors to be the total taxable value of land and additions on the property. | Land | Improvement |
|---|---|---|---|---|
| 2025 | $6,290 | $324,358 | $151,727 | $172,631 |
| 2024 | $6,290 | $317,999 | $148,752 | $169,247 |
| 2023 | $6,003 | $311,765 | $145,836 | $165,929 |
| 2022 | $5,916 | $305,653 | $142,977 | $162,676 |
| 2021 | $5,708 | $299,661 | $140,174 | $159,487 |
| 2020 | $5,519 | $296,589 | $138,737 | $157,852 |
| 2019 | $5,218 | $290,774 | $136,017 | $154,757 |
| 2018 | $5,052 | $285,073 | $133,350 | $151,723 |
| 2016 | $4,610 | $274,006 | $128,173 | $145,833 |
| 2015 | $4,494 | $269,891 | $126,248 | $143,643 |
| 2014 | $4,474 | $264,605 | $123,775 | $140,830 |
Source: Public Records
Map
Nearby Homes
- 4505 Lennox Blvd
- 11031 S Burin Ave
- 4341 W 106th St
- 4322 W 106th St
- 4323 W 105th St
- 10905 Dalerose Ave
- 10910 S Burl Ave
- 4203 W 104th St
- 11319 Larch Ave
- 4136 W 111th St
- 4115 W 111th St
- 10333 S Inglewood Ave
- 10914 S Osage Ave
- 4900 Lennox Blvd
- 4077 W 103rd St
- 11537 Birch Ave
- 11521 Inglewood Ave
- 11620 Inglewood Ave
- 3871 W 109th St Unit 1
- 4703 W 118th St
- 10913 S Grevillea Ave
- 10901 S Grevillea Ave
- 10919 S Grevillea Ave
- 10833 S Grevillea Ave
- 10908 Mansel Ave
- 10923 S Grevillea Ave
- 10904 Mansel Ave
- 10912 Mansel Ave
- 10900 Mansel Ave
- 10916 Mansel Ave
- 10902 S Grevillea Ave
- 10929 S Grevillea Ave
- 10832 Mansel Ave
- 10916 S Grevillea Ave
- 10922 Mansel Ave
- 10920 S Grevillea Ave
- 10926 S Grevillea Ave
- 10926 S Grevillea Ave
- 10922 S Grevillea Ave
- 10826 Mansel Ave