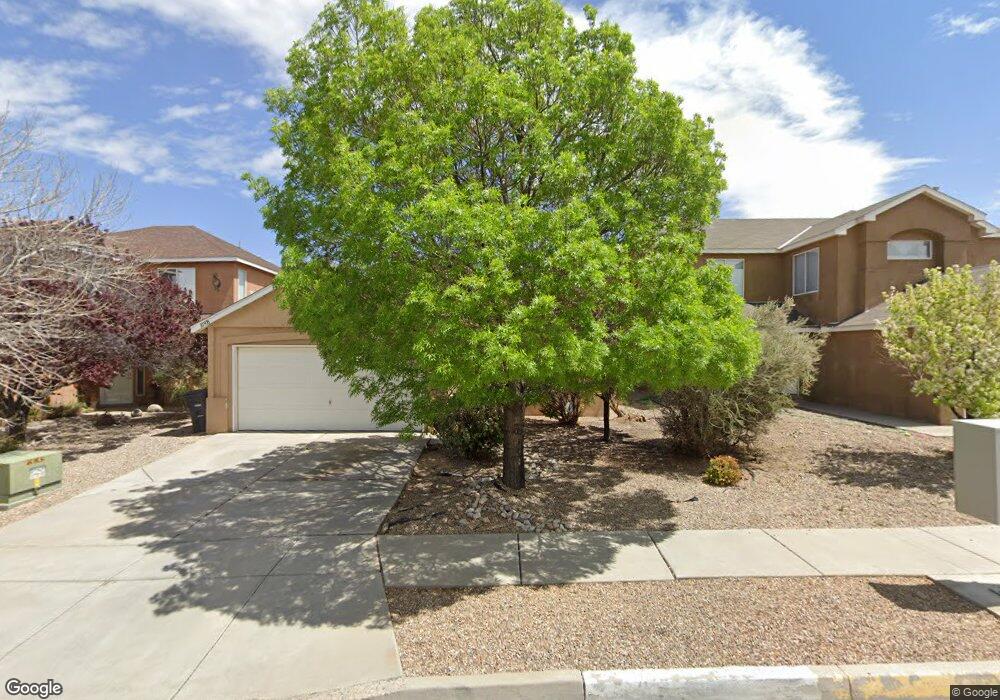
10908 Dreamy Way Dr NW Albuquerque, NM 87114
Skies West NeighborhoodEstimated Value: $313,000 - $344,000
3
Beds
2
Baths
1,600
Sq Ft
$203/Sq Ft
Est. Value
About This Home
This home is located at 10908 Dreamy Way Dr NW, Albuquerque, NM 87114 and is currently estimated at $324,385, approximately $202 per square foot. 10908 Dreamy Way Dr NW is a home located in Bernalillo County with nearby schools including Sierra Vista Elementary School, James Monroe Middle School, and Cibola High School.
Ownership History
Date
Name
Owned For
Owner Type
Purchase Details
Closed on
Jul 30, 2004
Sold by
Montano Fred M
Bought by
Mitchener Brian K
Current Estimated Value
Home Financials for this Owner
Home Financials are based on the most recent Mortgage that was taken out on this home.
Original Mortgage
$142,759
Outstanding Balance
$71,693
Interest Rate
6.3%
Mortgage Type
FHA
Estimated Equity
$252,692
Purchase Details
Closed on
Oct 8, 2002
Sold by
Schumann Steven C
Bought by
Montano Fred M
Home Financials for this Owner
Home Financials are based on the most recent Mortgage that was taken out on this home.
Original Mortgage
$112,000
Interest Rate
8.37%
Purchase Details
Closed on
Feb 19, 2002
Sold by
Los Suenos Llc
Bought by
Westbrook Village Llc
Home Financials for this Owner
Home Financials are based on the most recent Mortgage that was taken out on this home.
Original Mortgage
$96,750
Interest Rate
4.75%
Mortgage Type
Construction
Create a Home Valuation Report for This Property
The Home Valuation Report is an in-depth analysis detailing your home's value as well as a comparison with similar homes in the area
Home Values in the Area
Average Home Value in this Area
Purchase History
| Date | Buyer | Sale Price | Title Company |
|---|---|---|---|
| Mitchener Brian K | -- | Fidelity National Title Co | |
| Montano Fred M | -- | Fidelity National Title Co | |
| Westbrook Village Llc | -- | Fidelity National Title Co |
Source: Public Records
Mortgage History
| Date | Status | Borrower | Loan Amount |
|---|---|---|---|
| Open | Mitchener Brian K | $142,759 | |
| Previous Owner | Montano Fred M | $112,000 | |
| Previous Owner | Westbrook Village Llc | $96,750 |
Source: Public Records
Tax History Compared to Growth
Tax History
| Year | Tax Paid | Tax Assessment Tax Assessment Total Assessment is a certain percentage of the fair market value that is determined by local assessors to be the total taxable value of land and additions on the property. | Land | Improvement |
|---|---|---|---|---|
| 2025 | $2,455 | $59,930 | $11,555 | $48,375 |
| 2024 | $2,455 | $58,185 | $11,219 | $46,966 |
| 2023 | $2,414 | $56,490 | $10,892 | $45,598 |
| 2022 | $2,333 | $54,845 | $10,575 | $44,270 |
| 2021 | $2,254 | $53,248 | $10,267 | $42,981 |
| 2020 | $2,218 | $51,697 | $9,968 | $41,729 |
| 2019 | $2,152 | $50,192 | $9,678 | $40,514 |
| 2018 | $2,076 | $50,192 | $9,678 | $40,514 |
| 2017 | $2,012 | $48,730 | $9,396 | $39,334 |
| 2016 | $1,954 | $45,933 | $8,857 | $37,076 |
| 2015 | $44,595 | $44,595 | $8,599 | $35,996 |
| 2014 | $1,909 | $44,962 | $8,599 | $36,363 |
| 2013 | -- | $44,962 | $8,599 | $36,363 |
Source: Public Records
Map
Nearby Homes
- 10928 Sandman Dr NW
- 2421 Lynn Rd SE
- 1624 23rd Ave SE
- 5713 Pinnacle Peak Ct NW
- 5714 Pinnacle Peak Ct NW
- 1621 22nd Ave SE
- 2302 19th St SE
- 1729 22nd Ave SE
- 1709 22nd Ave SE
- 10627 Pisces Ct NW
- 2407 15th St SE
- 5609 Mesa Ridge Rd NW
- 2319 15th St SE
- 0 Mcmahon Blvd NW
- 1529 22nd Ave SE
- 6136 Malpais Park Ave NW
- 10616 Rigoletto Dr NW
- 6016 Canis Ave NW
- 10619 Rio Del Sole Ct NW
- 6160 Red Rock Park Ave NW
- 10904 Dreamy Way Dr NW
- 10923 Bandelier Dr NW
- 10900 Dreamy Way Dr NW
- 10919 Bandelier Dr NW
- 5772 Night Whisper Rd NW
- 5722 Night Whisper Rd NW
- 10915 Bandelier Dr NW
- 10828 Dreamy Way Dr NW
- 5800 Day Dreamer Rd NW
- 10909 Bandelier Dr NW
- 5804 Day Dreamer Rd NW
- 5805 Day Dreamer Rd NW
- 10824 Dreamy Way Dr NW
- 11000 Dreamy Way Dr NW
- 5801 Nightingale Ct NW
- 10905 Bandelier Dr NW
- 10920 Bandelier Dr NW
- 5808 Day Dreamer Rd NW
- 10928 Bandelier Dr NW
- 10924 Bandelier Dr