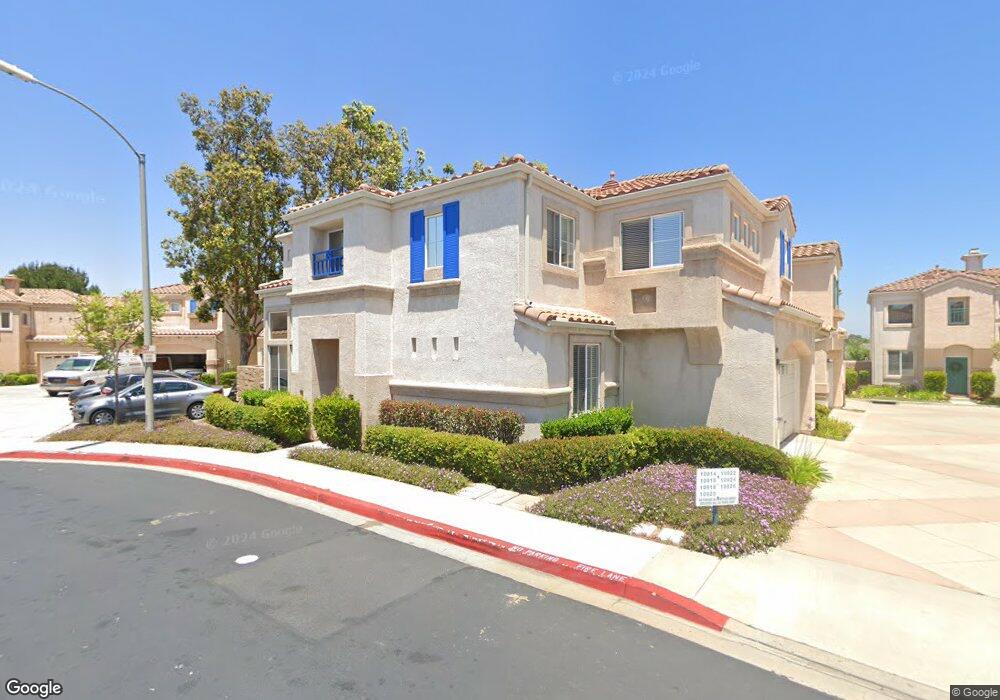
10910 Caminito Arcada San Diego, CA 92131
Miramar Ranch North NeighborhoodEstimated Value: $913,735 - $989,000
3
Beds
3
Baths
1,216
Sq Ft
$788/Sq Ft
Est. Value
About This Home
This home is located at 10910 Caminito Arcada, San Diego, CA 92131 and is currently estimated at $958,184, approximately $787 per square foot. 10910 Caminito Arcada is a home located in San Diego County with nearby schools including Dingeman Elementary School, Thurgood Marshall Middle School, and Scripps Ranch High School.
Ownership History
Date
Name
Owned For
Owner Type
Purchase Details
Closed on
Sep 10, 2024
Sold by
Kean Yin M
Bought by
Yin Ming Kean Revocable Trust and Kean
Current Estimated Value
Purchase Details
Closed on
Feb 8, 2007
Sold by
Kean Yin M and De Traversay Jean
Bought by
Kean Yin M
Purchase Details
Closed on
Jan 28, 1999
Sold by
Kean Yin P
Bought by
Kean Yin M
Home Financials for this Owner
Home Financials are based on the most recent Mortgage that was taken out on this home.
Original Mortgage
$161,000
Interest Rate
6.63%
Purchase Details
Closed on
Aug 20, 1997
Sold by
Encore Scripps Ranch Lp
Bought by
Kean Yin M and Kean Yin P
Home Financials for this Owner
Home Financials are based on the most recent Mortgage that was taken out on this home.
Original Mortgage
$160,950
Interest Rate
7.45%
Mortgage Type
FHA
Create a Home Valuation Report for This Property
The Home Valuation Report is an in-depth analysis detailing your home's value as well as a comparison with similar homes in the area
Home Values in the Area
Average Home Value in this Area
Purchase History
| Date | Buyer | Sale Price | Title Company |
|---|---|---|---|
| Yin Ming Kean Revocable Trust | -- | None Listed On Document | |
| Kean Yin M | -- | Chicago Title Co | |
| Kean Yin M | -- | United Title Company | |
| Kean Yin M | $170,000 | First American Title |
Source: Public Records
Mortgage History
| Date | Status | Borrower | Loan Amount |
|---|---|---|---|
| Previous Owner | Kean Yin M | $161,000 | |
| Previous Owner | Kean Yin M | $160,950 |
Source: Public Records
Tax History Compared to Growth
Tax History
| Year | Tax Paid | Tax Assessment Tax Assessment Total Assessment is a certain percentage of the fair market value that is determined by local assessors to be the total taxable value of land and additions on the property. | Land | Improvement |
|---|---|---|---|---|
| 2025 | $3,821 | $292,391 | $122,429 | $169,962 |
| 2024 | $3,821 | $286,659 | $120,029 | $166,630 |
| 2023 | $3,729 | $281,039 | $117,676 | $163,363 |
| 2022 | $3,586 | $275,529 | $115,369 | $160,160 |
| 2021 | $3,554 | $270,127 | $113,107 | $157,020 |
| 2020 | $3,513 | $267,358 | $111,948 | $155,410 |
| 2019 | $3,640 | $262,116 | $109,753 | $152,363 |
| 2018 | $3,859 | $256,977 | $107,601 | $149,376 |
| 2017 | $3,794 | $251,940 | $105,492 | $146,448 |
| 2016 | $3,748 | $247,001 | $103,424 | $143,577 |
| 2015 | $3,705 | $243,292 | $101,871 | $141,421 |
| 2014 | $3,654 | $238,527 | $99,876 | $138,651 |
Source: Public Records
Map
Nearby Homes
- 10818 Caminito Arcada
- 10941 Waterton Rd
- 10914 Ivy Hill Dr Unit 1
- 11629 Swan Lake Dr Unit 4
- 12490 Heatherton Ct Unit 8
- 12530 Heatherton Ct Unit 31
- 11121 Catarina Ln Unit 73
- 10978 Serafina Ln Unit 69
- 11793 Alderhill Terrace
- 12665 Creekview Dr Unit 140
- 12626 Springbrook Dr Unit A
- 12662 Springbrook Dr Unit D
- 12670 Springbrook Dr Unit D
- 12676 Springbrook Dr Unit B
- 10804 Serafina Ln Unit 6
- 11482 Cortina Place
- 11553 Trailbrook Ln Unit 2
- 11365 Affinity Ct Unit 192
- 11590 Trailbrook Ln
- 11825 Miro Cir
- 10908 Caminito Arcada
- 10916 Caminito Arcada
- 10914 Caminito Arcada Unit 169
- 10906 Caminito Arcada Unit 166
- 10898 Caminito Arcada
- 10926 Caminito Arcada
- 10922 Caminito Arcada Unit 173
- 10918 Caminito Arcada
- 10920 Caminito Arcada
- 10904 Caminito Arcada
- 10896 Caminito Arcada
- 10924 Caminito Arcada
- 10902 Caminito Arcada
- 10930 Caminito Arcada
- 10890 Caminito Arcada
- 10946 Caminito Arcada
- 10948 Caminito Arcada
- 10888 Caminito Arcada
- 10944 Caminito Arcada Unit 176
- 10942 Caminito Arcada